
api-governance
How do API-first teams track the performance and usage of their APIs?

Summarize with


API First is a methodology where development teams prioritize their API, with API consumption being the primary goal. Within these teams, APIs are the focus to make them stand out from competitors.
It’s a great way for teams to create a full ecosystem around their products, making them reusable and flexible for end users. Plus, it enables teams to develop a better understanding of their own APIs, which can help improve the speed to market or improve your team’s developer experience.
However, in order to maximize the effectiveness of your API — whether you’re an API-first team or not — you’ll need some way to see how your API is performing and how to manage it.
API usage
Your APIs are a tool — one that your teams could be seriously neglecting if they aren’t paying attention to it. Here are some examples of the information you can glean from tracking API performance metrics:
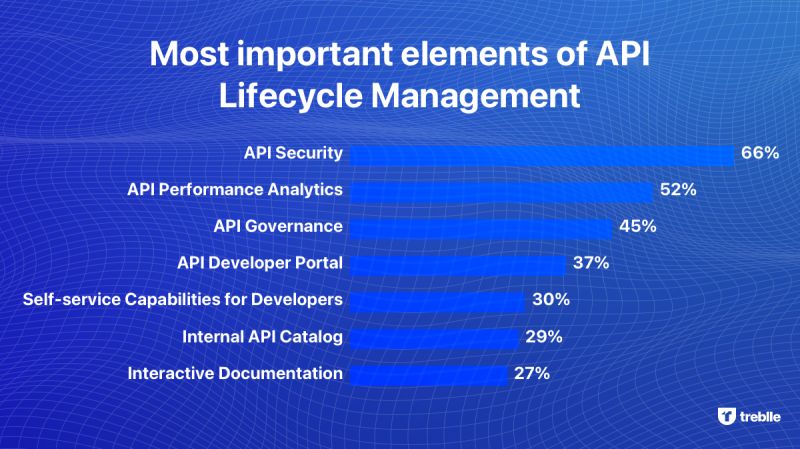
52% of IT leaders identified API performance analytics as a critical component of their APIs.
It’s no secret that API managers are in demand — 54% of organizations stated one of their biggest struggles was to find one! These positions own their product and are responsible for managing the production and development for their API, and to focus on either monetization or improving your company’s developer experience.
Most importantly, API managers work with dev teams to elevate their API and work to understand their team’s needs. They also assist with making their API as accessible as possible to increase adoption rates and assist clients with integrating it into their systems.
Finally, they’re responsible for bringing insights and analytics to their API, which helps them in all other aspects of their role — and helps your organization overall!
Most importantly, whether you hire an API manager or not, gathering the best insight into how your API is performing is the secret to a successful API. When you keep a close eye on your metrics, you’ll be able to not only see how your users consume your API, but you’ll also be able to see what areas need improvement or what endpoints need more attention.

While this isn’t an exhaustive list, here are some key metrics we think you should be tracking:
The most basic metric you can track, uptime focuses on showing you how available your API is, and helping you maintain Service Level Agreements (SLAs). Generally, this is measured by looking at downtimes in your API across a full year as a percentage.
Typically known as “nines”, you’ll be working toward maximizing your uptime, from 99% (which can be something around 4 days of downtime in a year) up to 99.999% (around 5 minutes of downtime in a year). By maximizing your uptime, you’ll have a much more stable product and will be able to keep clients and users happy.
Your Requests Per Minute (RPM) is generally used for measuring an API’s throughput, and it can be a deceiving metric. Your RPM can be incredibly high, but that doesn’t always mean that it’s a good thing.
With a high RPM, your API may be getting multiple requests that could have been bundled into one, which means there’s room for improvement. If all of your users make similar API calls, you should consider combining endpoints and API calls. RPM also doesn’t take into account server latency or third-party solutions, so be careful with how you use this metric.
KEY API METRICS
☑️ Uptime (or Availability)
☑️ Requests Per Minute
☑️ Errors Per Minute
☑️ API Usage Growth
☑️ API Retention
☑️ CPU & Memory Usage
On the other hand, Errors Per Minute is key to showing you how error-prone your API is or if you’re being attacked by a malicious user. Not only do you need to look at how many errors you’re having, but you should also keep in mind what errors are occurring.
By tracking your errors per minute and dividing it by error type, your teams will be able to paint a better picture of how users are using your API. If your team sees a heavy amount of 500 errors, there may be an issue within your API’s code, while seeing several 401 errors may indicate a cyberattack has occurred.
Naturally, you want your API to be used by as many people as possible. By tracking your API Usage, you’ll have a clear idea of how widely used your product is. Unlike RPM, you should be tracking your growth over longer periods, such as weeks or months.
When tracking your growth, you’ll need to keep in mind how your userbase consumes your API. If your clients are typically banks, expect slower business on weekends and evenings. Factoring in length of time matters too, as not all months are the same length, so by stetting it at 28 days, you’ll remove any bias for longer or shorter months.
Products with high retention rates normally indicate that it’s on the right track for wider adoption. By tracking this metric, you’ll be able to see how users value your product and will be able to pivot if your retention rates are too low. If your churn (the opposite of retention) is too high, it’s a clear sign there’s something wrong with your product.
This metric also helps API managers with their ultimate goal of monetization. Armed with this metric, they will be able to better direct their dev teams to improve their API, which will in turn increase subscription rates.
By measuring how they use resources, teams will have a better understanding of their API’s overall health. Tracking these metrics indicates different things, so let’s dive in a bit:
While having good usage is important, it doesn’t signify whether or not all of your API traffic is coming from multiple clients or just one. When you track the unique users for your API (generally by monthly trends) you’re able to paint a better picture of your overall acquisition and growth of new users.
In an API-first team, you need to be able to show your company how valuable your APIs are. And the only way to do that is with hard data, and advocating for your API. By tracking important metrics and utilizing an API Product Manager, you’ll be able to not only make your API grow, but flourish.
And if you need a platform to help you track these vital metrics and more, look no further than Treblle. We can help you get the analytics and monitoring you need to maintain your API, and we can guide you on improving it too.
💡
All Systems Operational
Gartner: Magic Quadrant, 2025
Gartner AI API Strategy, 2025
Everest Group: Enterprise App Integration Platforms, 2026


