By industry
By initiatives
API Monitoring and Observability
7 min read
Master API monitoring and observability with practical implementation strategies, real-time tracking, error detection, and performance optimization techniques for production-ready APIs.

Building an API is just the starting point.
Once your API goes live, you must understand its performance, detect issues before users notice them, and continuously optimize its behavior. This is where monitoring and observability become crucial for maintaining reliable, high-performing APIs.
Monitoring tracks predefined metrics and alerts you when thresholds are exceeded. It answers "Is my API working?"
Observability provides deeper insights into your API's internal behavior through external outputs. It answers the question, "Why is my API behaving this way?"
Why API Monitoring and Observability Matter
For intermediate developers building production APIs, monitoring and observability provide critical operational benefits:
- Proactive Issue Detection: Identify problems before they escalate into user-facing incidents. Catch performance degradation, memory leaks, or dependency failures early in their development.
- Data-Driven Optimization: Use concrete metrics to guide performance improvements. Instead of guessing where bottlenecks exist, you can pinpoint which endpoints need attention.
- Security Insight: Detect suspicious activity patterns, unusual request volumes, or potential attack vectors through behavioral analysis.
- Capacity Planning: Understand usage patterns to make informed decisions about scaling resources and infrastructure investments.
- Debugging Context: When issues occur, rich observability data provides the context needed to identify root causes and implement fixes quickly.
Essential Metrics for API Monitoring
Effective API monitoring focuses on metrics that provide actionable insights into system health and user experience.
-
Request Rate and Traffic Patterns
Request rate monitoring reveals how your API usage changes over time, helping you understand peak hours, seasonal variations, and growth trends. The AI Prompt Enhancer project demonstrates request rate monitoring through its rate-limiting implementation:
-
Response Time Analysis
Response time directly impacts user experience and system performance. Monitor not just average response times, but also percentiles (95th, 99th) to understand the complete performance picture:
-
Error Rate Tracking
Error monitoring should distinguish between different types of failures. Client errors (4xx) often indicate API design issues or documentation problems, while server errors (5xx) suggest infrastructure or code problems:
-
Resource Utilization Monitoring
Track system resources to prevent performance degradation and plan capacity upgrades.
Core Components of Observability
-
Metrics
Metrics provide the quantitative backbone of your observability strategy. They track values over time, such as average response time, total requests per minute, and percentage of errors, allowing you to detect trends and deviations at a glance.
For example, a sudden jump in 5xx error rate can trigger an alert before customers report problems.
-
Logs
Logs are structured, timestamped records of individual events within your API. By including consistent fields (for instance,
request_id,user_id,endpoint, andstatus_codeYou can filter and search through millions of entries to reconstruct the exact sequence of operations that caused the issue.JSON-formatted logs make visualizing payload data, error messages, and contextual metadata easy.
-
Traces
Traces follow a single request as it travels through your system, divided into spans representing each operation, database queries, downstream HTTP calls, or business-logic execution. By capturing start/end times and parent-child relationships, you can pinpoint which segment contributed most to latency.
Trace IDs also bind metrics and logs, allowing you to seamlessly move from a slow histogram bucket to the exact log entries.
-
Service Maps
Service maps automatically generate a visual graph of your API’s architecture, showing how microservices or modules interact. Nodes represent individual services, while edges indicate call relationships and average latency between components.
Service maps help you understand the big picture. You can see which upstream or downstream dependencies might be affected when one service slows down.
Implementing API Observability with Treblle
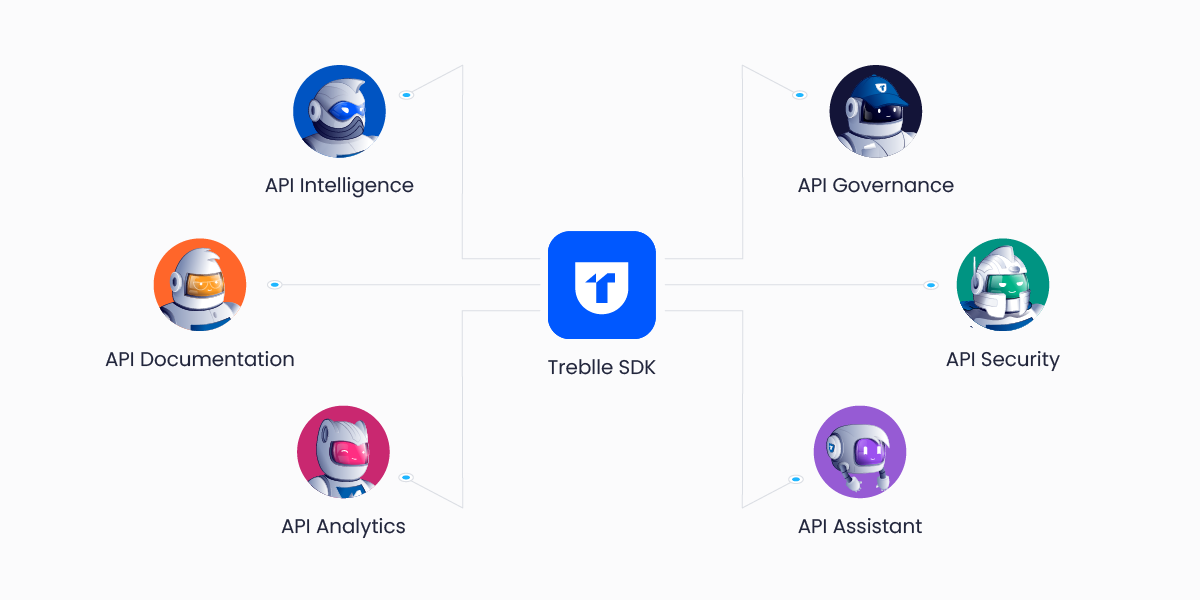
Treblle represents a paradigm shift in API monitoring and observability, providing a unified platform that captures deep insights into API behavior without requiring extensive infrastructure setup.

Once you add the Treblle middleware or SDK automatically captures metrics, logs, and traces for every endpoint and downstream call.
Installing Treblle's Express SDK
To add Treblle to your Express application, first install the SDK using npm:
npm i @treblle/express --saveSetting Up Credentials
The @treblle/express package expects you to set your Treblle API key and project ID as environment variables in a .env file or your production environment. The environment variables that the system checks are:
-
TREBLLE_API_KEY
-
TREBLLE_PROJECT_ID
Integrating Treblle With Express.js
Here's how to implement Treblle in your Express application:
const express = require('express');
const treblle = require('@treblle/express');

const app = express();

app.use(treblle({
    apiKey: process.env.TREBLLE_API_KEY,
    projectId: process.env.TREBLLE_PROJECT_ID,
    additionalFieldsToMask: ['password', 'creditCard'], // Optional fields to mask
}));
In the AI Prompt Enhancer project, Treblle implements conditional activation for production.
Here's how Treblle integrates into the application:
// Apply Treblle logging only in production environments

if (process.env.NODE_ENV === 'production') {
    const treblleApiKey = process.env.TREBLLE_API_KEY;
    const treblleProjectId = process.env.TREBLLE_PROJECT_ID;

    if (treblleApiKey && treblleProjectId) {
        try {
            const treblle = require('@treblle/express');

            app.use(treblle({
                apiKey: treblleApiKey,
                projectId: treblleProjectId,
                additionalFieldsToMask: ['password', 'creditCard', 'ssn'], // Protect sensitive data
            }));

            console.log('🔍 Treblle API monitoring enabled for production');
        } catch (error) {
            console.error('❌ Failed to initialize Treblle:', error.message);
            // Continue operation without monitoring rather than crashing
        }
    } else {
        console.warn('⚠️ Treblle not configured: Missing API Key or Project ID');
    }
}
This implementation shows several best practices:
-
Only enabling monitoring in production to avoid development noise
-
Using environment variables for configuration
-
Implementing proper error handling for the monitoring setup itself
-
Providing clear logging about the monitoring status
Sensitive Data Protection
Treblle includes built-in data masking to protect sensitive information:
// Configure field masking
app.use(treblle({
    apiKey: process.env.TREBLLE_API_KEY,
    projectId: process.env.TREBLLE_PROJECT_ID,
    additionalFieldsToMask: [
        'email',
        'phone_number',
        'credit_card',
        'ssn',
        'api_key',
        'password',
        'openai_api_key'
    ]
}));
Masked fields appear as asterisks (****) in the dashboard while preserving the original field structure for debugging.
Comprehensive Data Collection
Treblle automatically captures over 100 data points from each API request, including:
- Request Intelligence: Complete request details including method, URL, headers, query parameters, and request body (with sensitive data masked)
- Response Analysis: Full response data including status codes, headers, response body, and response times
- Performance Metrics: Detailed timing information, payload sizes, and performance benchmarks
- Error Context: When errors occur, Treblle captures the complete context, including stack traces, error types, and environmental factors
- Security Monitoring: Automatic detection of suspicious patterns, unusual request volumes, and potential security threats
This comprehensive data collection enables you to understand API behavior patterns, identify optimization opportunities, and debug issues with complete context.
Best Practices for Production APIs
Choose the Right Tools
Select monitoring tools that match your team's needs and technical environment.
Treblle offers particular advantages for API-focused teams:
- Specialized for APIs: Unlike generic monitoring tools, Treblle understands API-specific metrics and provides relevant insights
- Minimal Setup: Single SDK integration provides comprehensive monitoring without complex configuration
- Developer-Friendly: Designed for development teams with intuitive interfaces and actionable alerts
- Automatic Documentation: Keeps API documentation current based on actual usage patterns
Secure Your Monitoring
Ensure monitoring systems don't create security vulnerabilities:
- Mask sensitive data before transmission to monitoring systems
- Use secure transport (HTTPS/TLS) for all monitoring data
- Implement proper access controls for monitoring dashboards
- Regularly audit what data is being collected and transmitted
Document Your Monitoring
Maintain clear documentation about:
- What metrics do you monitor and why
- How to interpret alerts and dashboards
- Escalation procedures for different alert types
- Historical context for metric baselines and thresholds
API monitoring and observability are essential for maintaining reliable, performant APIs in production. The key to successful API observability is choosing tools that provide actionable insights without overwhelming complexity.
The AI Prompt Enhancer project demonstrates how proper monitoring integration can be achieved with minimal code changes while providing comprehensive production insights.
