
Add the Treblle SDK to your API in your language of choice. Available across 40+ languages and frameworks. Zero configuration, zero performance impact.
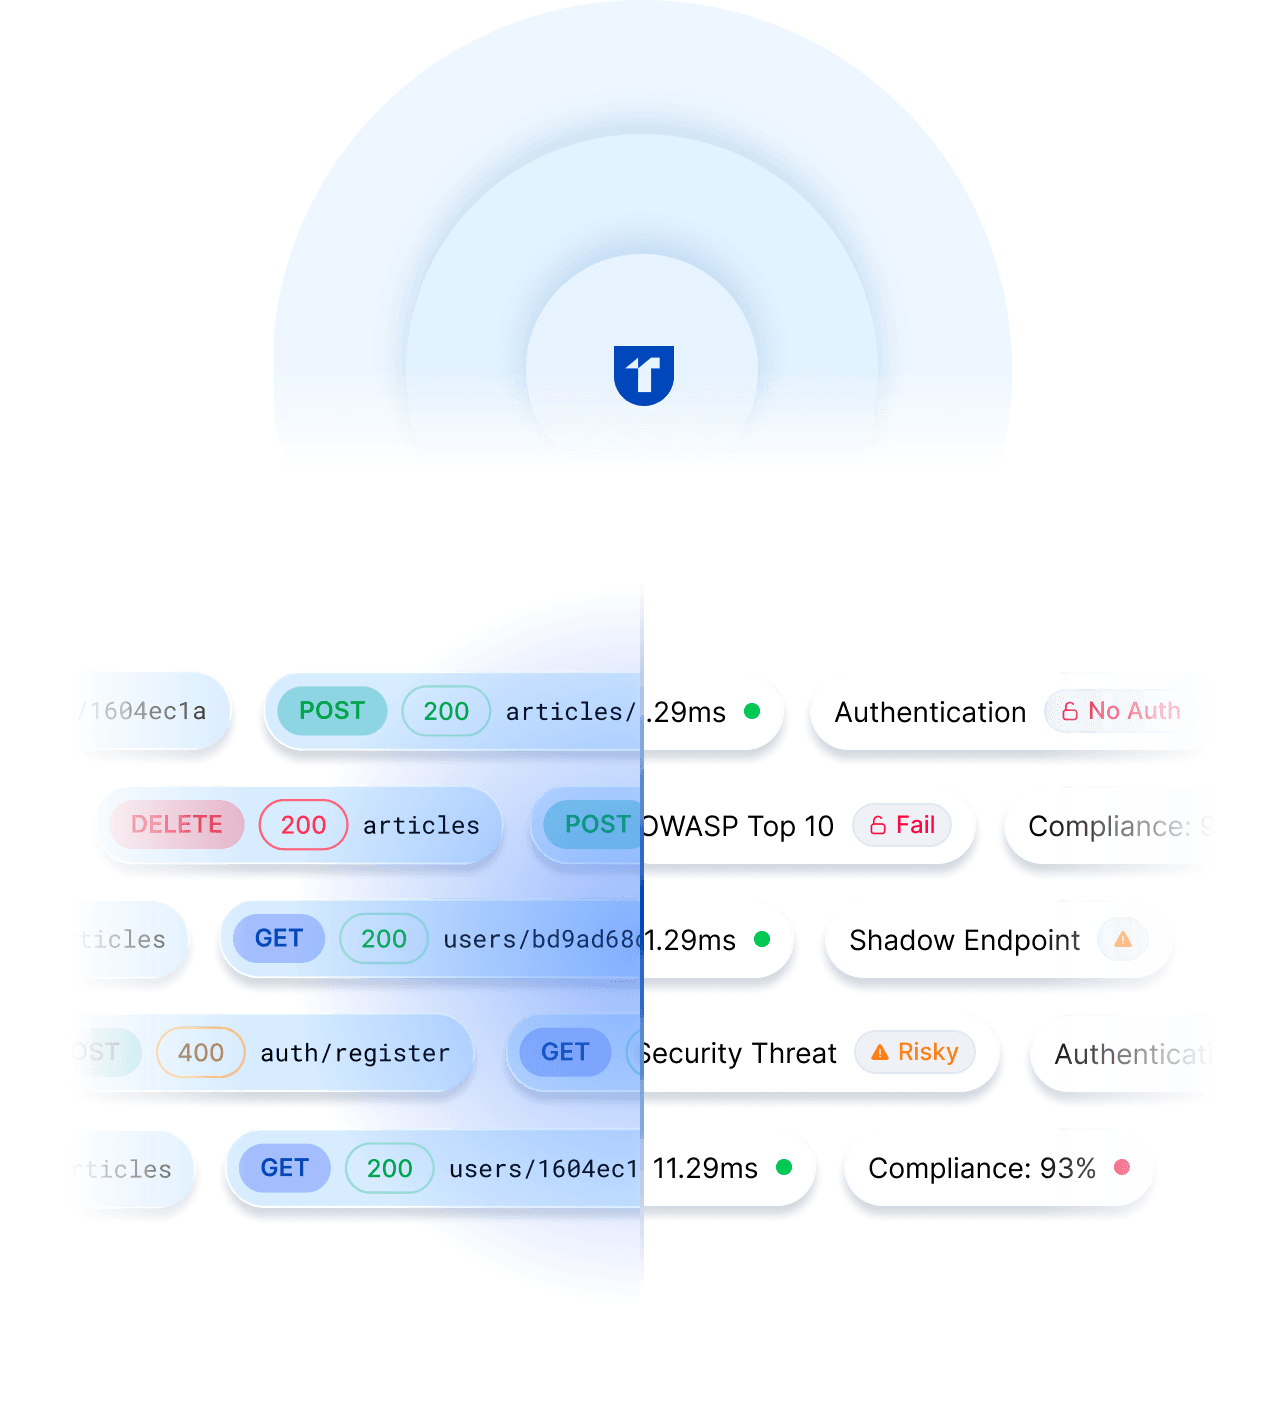
From that point, 100% of your API traffic is captured in real time with over 50 data points per request, including full payloads, with sensitive fields masked before leaving your infrastructure.
Explore requests in a UI built for API teams, filter across any dimension in real time, save views for recurring workflows, and share context instantly across your team.
What is API Observability?
API observability is the ability to understand the internal state of an API system from the data it produces, including requests, responses, performance metrics, and error patterns. Unlike basic API monitoring, which tracks whether an API is up or down, observability captures the full context of every interaction so engineering teams can debug issues, understand consumer behavior, and improve API quality over time. Treblle provides complete API observability from a single SDK integration, capturing over 50 data points per request across any language or framework.
Full Coverage
Most API monitoring tools sample traffic or process data in batches. Treblle captures every request with over 50 data points the moment it happens, across 40+ languages and frameworks, with zero added latency. No approximations, no blind spots between batch windows.
Every API request captured in real time with over 50 data points. No sampling, no aggregation, complete visibility into every call.
All captured data is available in Treblle the moment it happens. No batch processing delays or ingestion lag between a request and its visibility.
Zero impact on API performance or latency across 40+ languages and frameworks. Purpose-built for API data collection, not repurposed logging agents.


Request Context
Log aggregators show you that a request failed. Treblle shows you exactly what was sent and what came back. Full request and response bodies, structured and readable in a UI built for API engineers, not SREs parsing raw log output.
Captures full request and response bodies, not just metadata. Gives API teams the context they need to debug and understand behavior.
A UI designed around viewing API requests, not raw log files. Structured, readable, and built for how API teams actually work.


Search and Filter
Filter by status code, endpoint, latency, consumer location, device, HTTP client, and any custom metadata you've attached via the SDK. All in real time, without writing a single query. Save complex filter combinations as named views and reuse them across your team.
Search and filter across all 50+ data points in real time, including custom metadata. Find the exact request you need without writing queries.
Save complex filter combinations and reuse them instantly. Build reusable views for recurring debugging or monitoring workflows.
Attach your own key/value pairs to any request via the SDK. Filter and search on business-specific dimensions alongside Treblle's built-in data points.


Beyond Infrastructure
Raw metrics tell you a request was slow. Treblle tells you which consumer it affected, what they were trying to do, where they were calling from, and how it compares to their last 30 days of activity. Sensitive fields are masked at the point of capture, before data ever leaves your infrastructure, so compliance and visibility coexist.
Treblle surfaces business insights, KPIs, and cross-functional context alongside infrastructure data. Built for API teams, product owners, and leadership, not just SREs.
SDKs mask sensitive fields before data leaves your infrastructure. Fully configurable: specific properties, nested objects, arrays, and wildcards. Masked data is never transmitted.


Treblle works best when working in unison. Check out other capabilities that will help you make the most out of your API landscape.
API Security
Compliance signals feed directly into security threat scoring, so a GDPR violation on an endpoint raises the security risk level for the same traffic.
API Analytics
Turn observability data into long-term consumer analytics: adoption trends, geographic patterns, device intelligence, and period-over-period comparisons.
API Intelligence
Cross-signal intelligence that combines observability, security, governance, and compliance data into predictive risk detection and executive dashboards.
All Systems Operational
Gartner: Magic Quadrant, 2025
Gartner AI API Strategy, 2025
Everest Group: Enterprise App Integration Platforms, 2026