api-design
How to Get Complete API Visibility in MuleSoft with Treblle's Auto-Discovery

Summarize with


If you're running MuleSoft in production, you've faced this challenge: APIs get deployed across different environments and business groups, but there's no centralized way to track what's actually running.
You might have monitoring on some APIs through policies, but what about the ones that don't?
How do you even know they exist?
I recently implemented Treblle's Auto-Discovery app to solve exactly this problem. Instead of manually hunting for APIs across our MuleSoft organization, this app automatically scans everything and gives you a complete inventory.
Here's how to set it up and what you'll discover about your API landscape.
Need real-time insight into how your APIs are used and performing?
Treblle helps you monitor, debug, and optimize every API request.
Explore Treblle
The core problem is simple: MuleSoft doesn't give you a single view of all your APIs and their monitoring status.
You can see APIs in API Manager, but you can't easily tell which ones have policies applied, are actively used, or are just sitting there consuming resources.
Auto-Discovery changes this by:
Scanning your entire MuleSoft organization automatically
Finding APIs regardless of whether they have Treblle policies
Registering everything in your Treblle dashboard
Providing usage data and health metrics for complete visibility
This works alongside the Treblle monitoring policy, so you get discovery and detailed observability data.
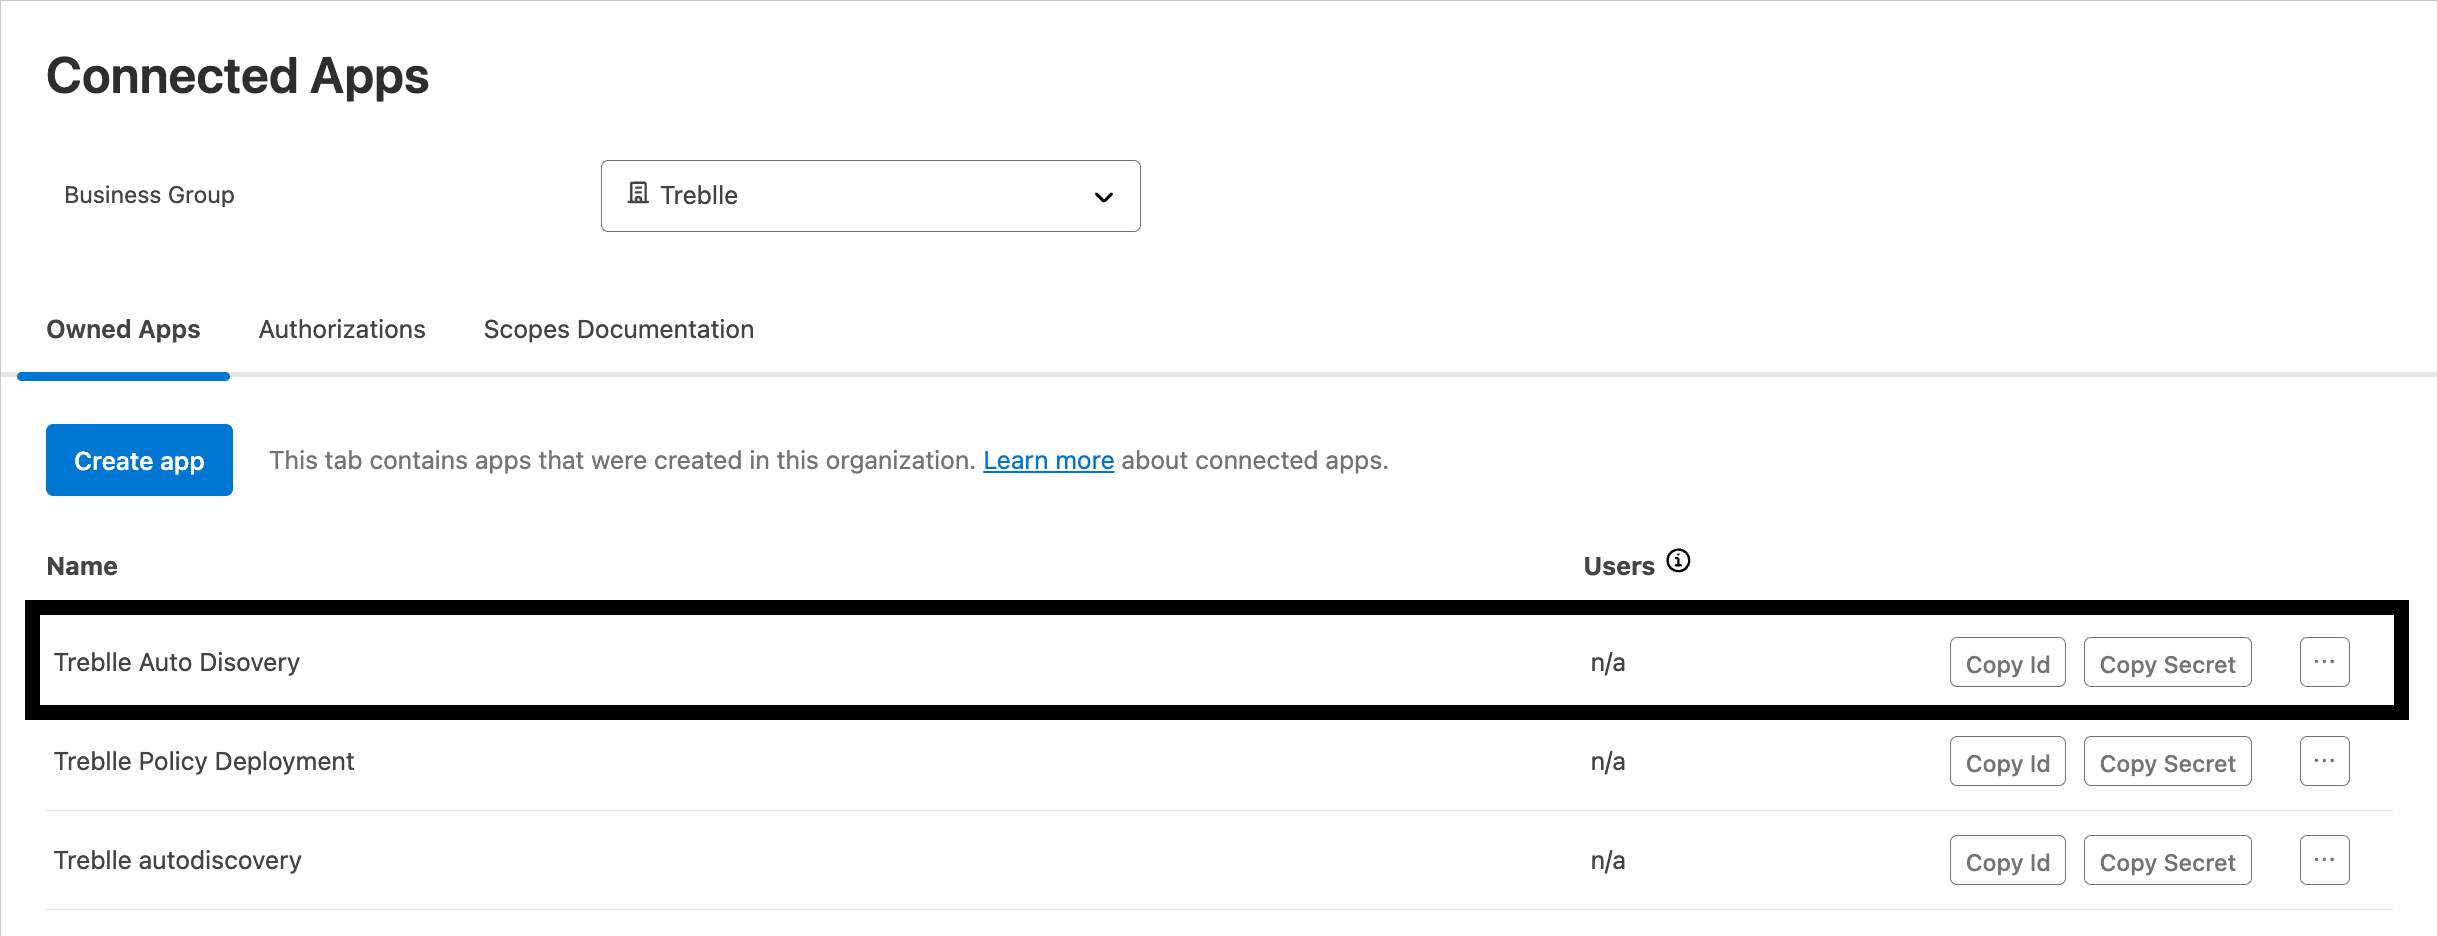
The first step was to create a Connected App that would give the Auto-Discovery app permission to read our organization's data (If you’re just starting out, we’ve written a full guide on MuleSoft API setup with Treblle that covers the basics). I went to Access Management > Connected Apps and hit "Create app."
![]()
The key is selecting "App acts on its behalf (client credentials)" since this needs to run without human intervention.
For scopes, I needed:
API Manager (to read API configurations)
View APIs Configuration (to see API details)
View Policies (to check policy status)
View Environment (for different environments)
View Organization (for org-level access)
Once created, I grabbed the Client ID and Client Secret, which act as the app's authentication tokens.
Our setup spans multiple business groups, which adds complexity. I had to expand the Connected App scopes to include all business groups I wanted visibility into. If you’re facing the same challenge, here’s a guide on how to scale API monitoring across multiple MuleSoft environments with Treblle.
![]()
In the scope management dialog, I selected each business group and ensured they all had identical permissions. This took a few extra minutes but was essential for complete coverage.
Need real-time insight into how your APIs are used and performing?
Treblle helps you monitor, debug, and optimize every API request.
Explore TreblleI cloned the Treblle repository and found the pre-built JAR file rather than building from source:
git clone https://github.com/Treblle/treblle-mulesoft-autodiscovery.git
The JAR file treblle-register-apis-1.0.2-SNAPSHOT-mule-application.jar was ready to deploy.
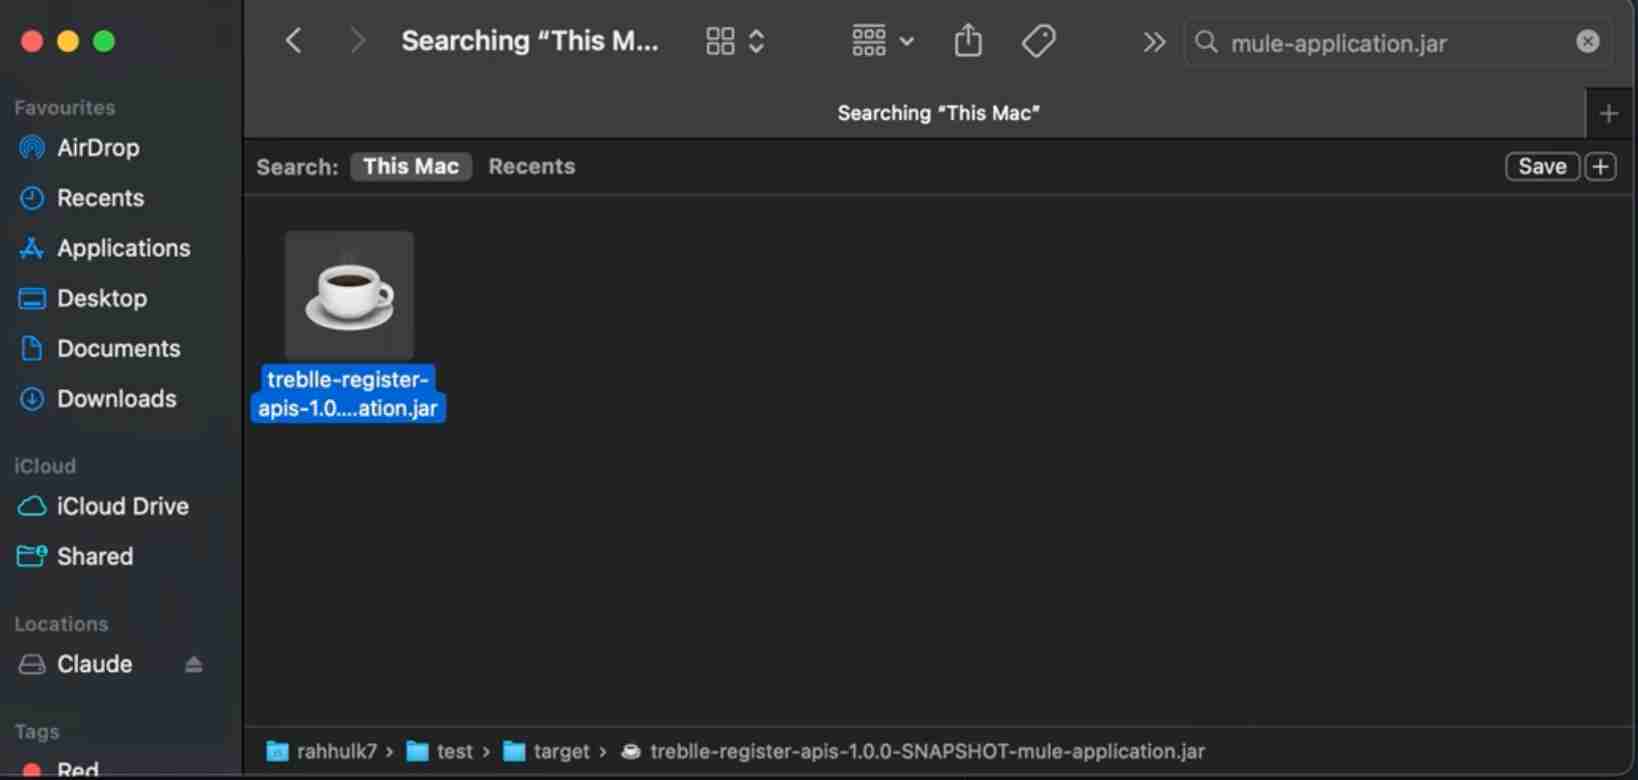
In Runtime Manager, I clicked "Deploy application" and uploaded the JAR.
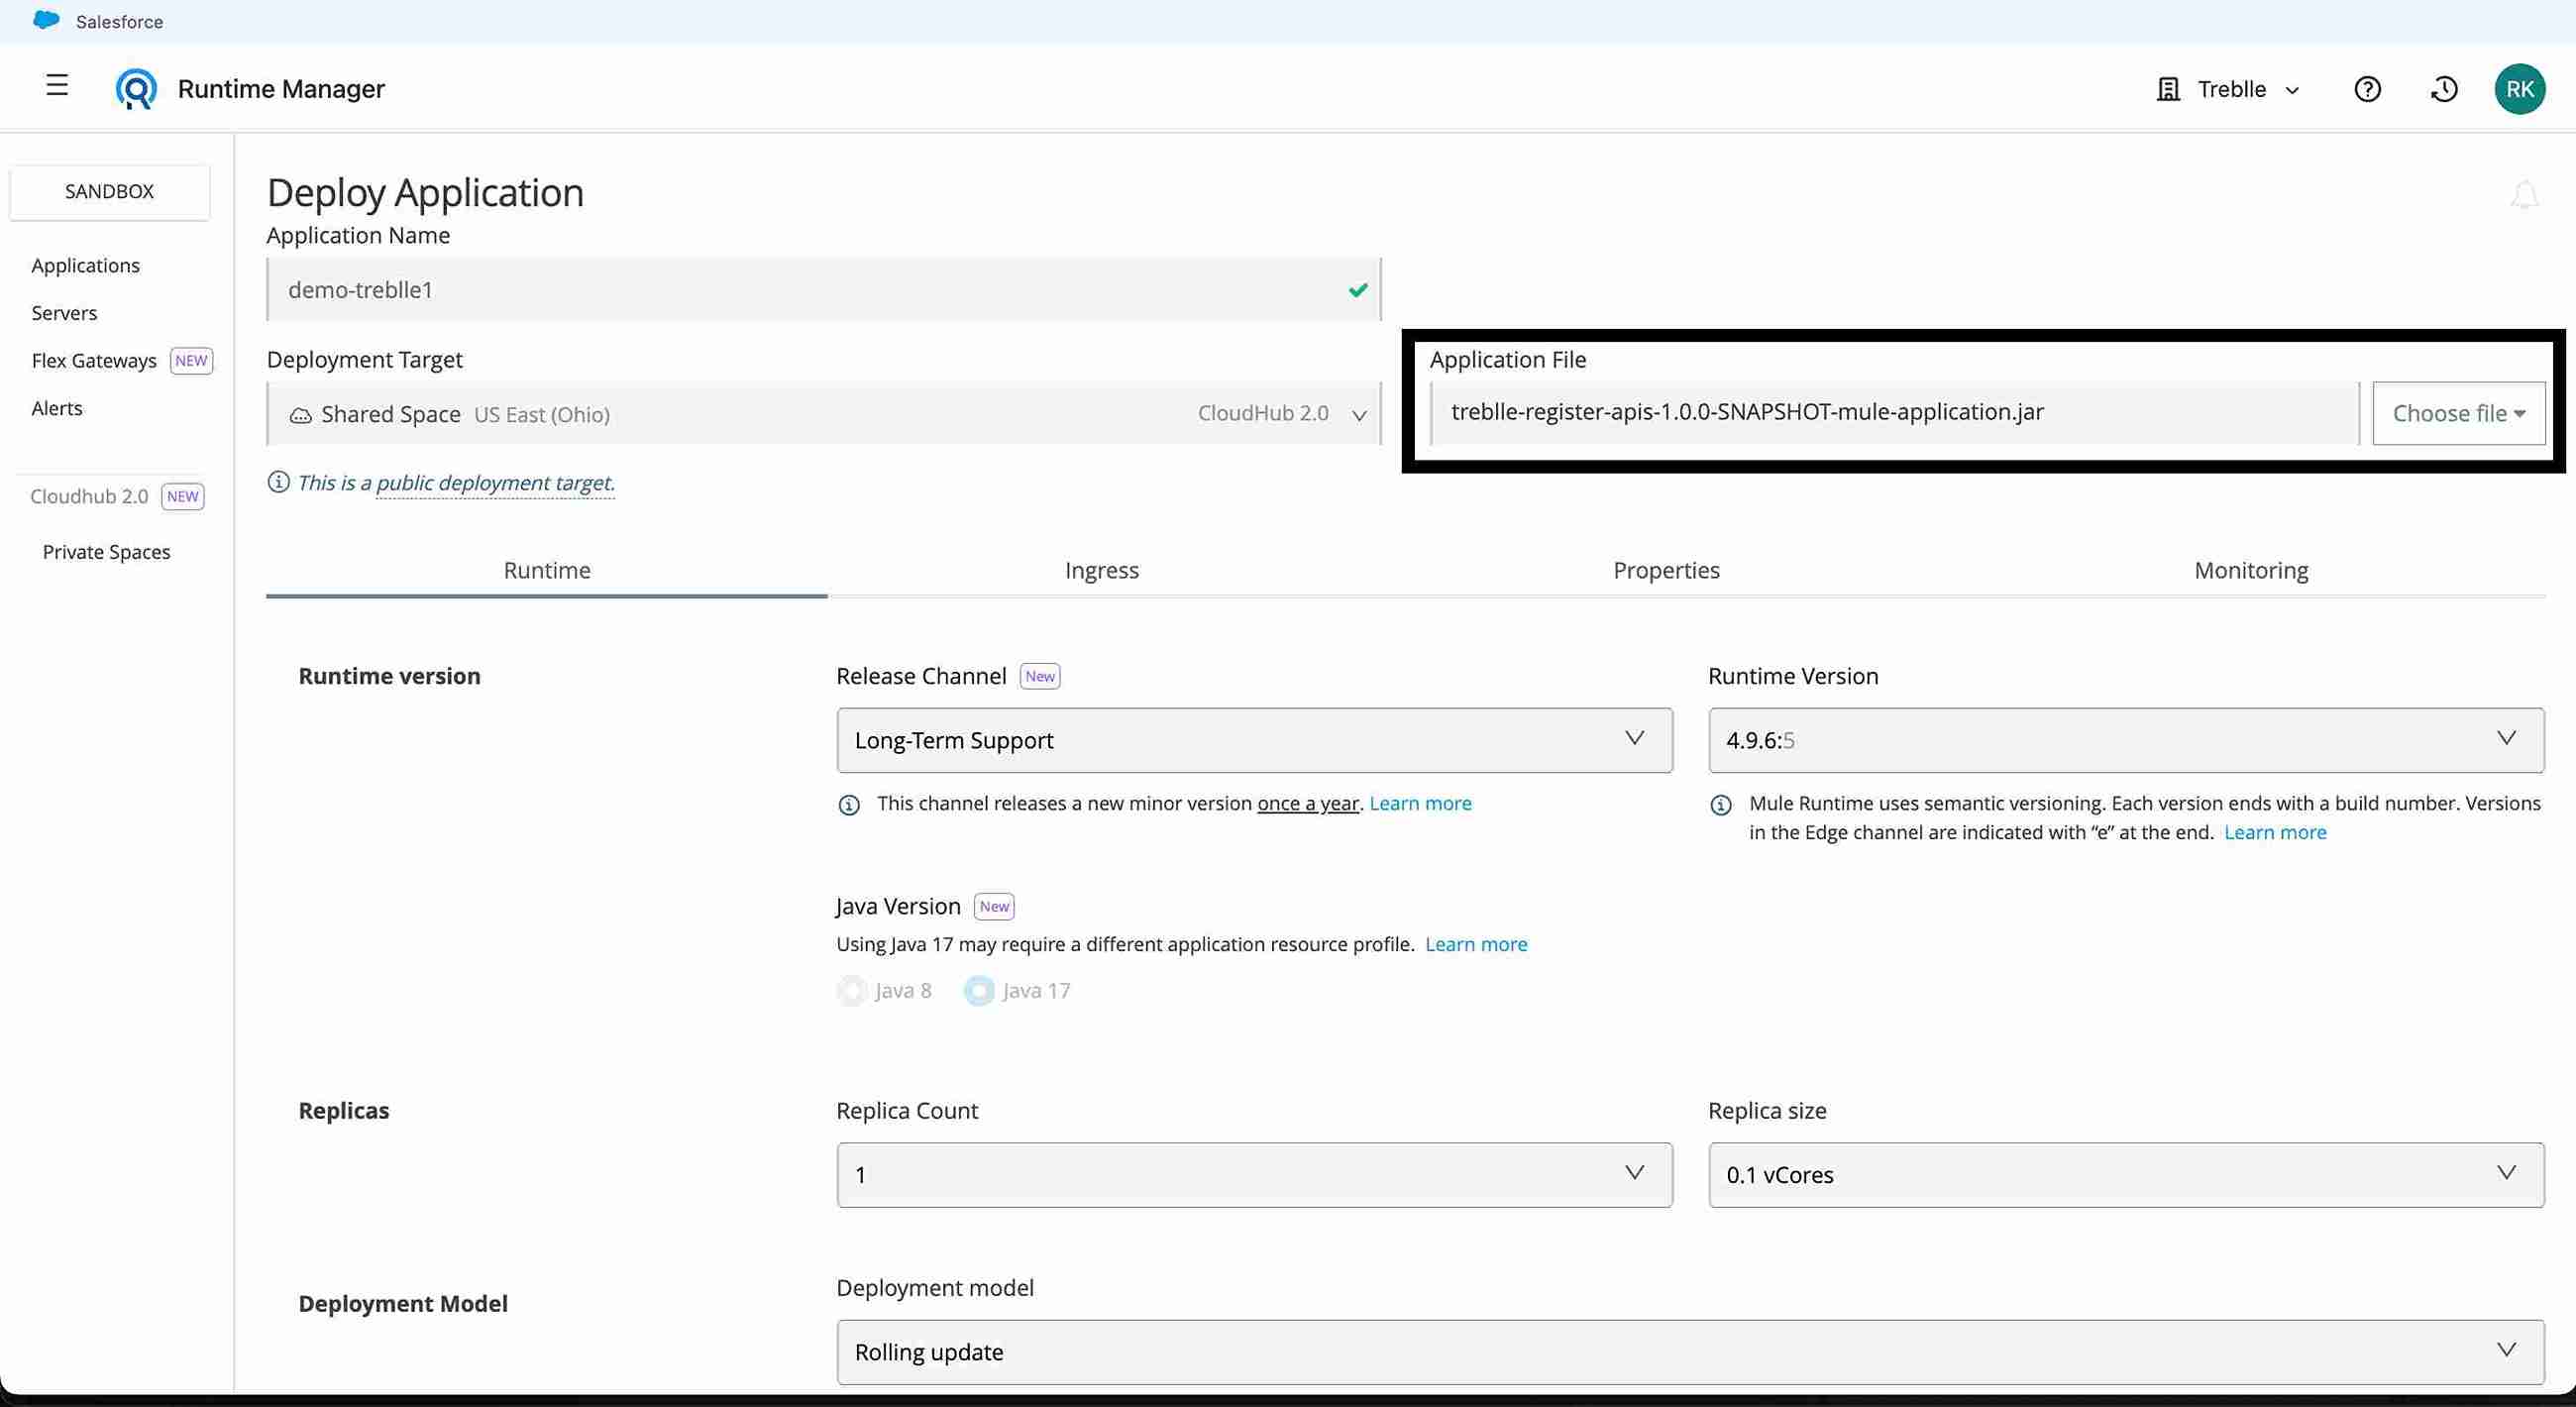
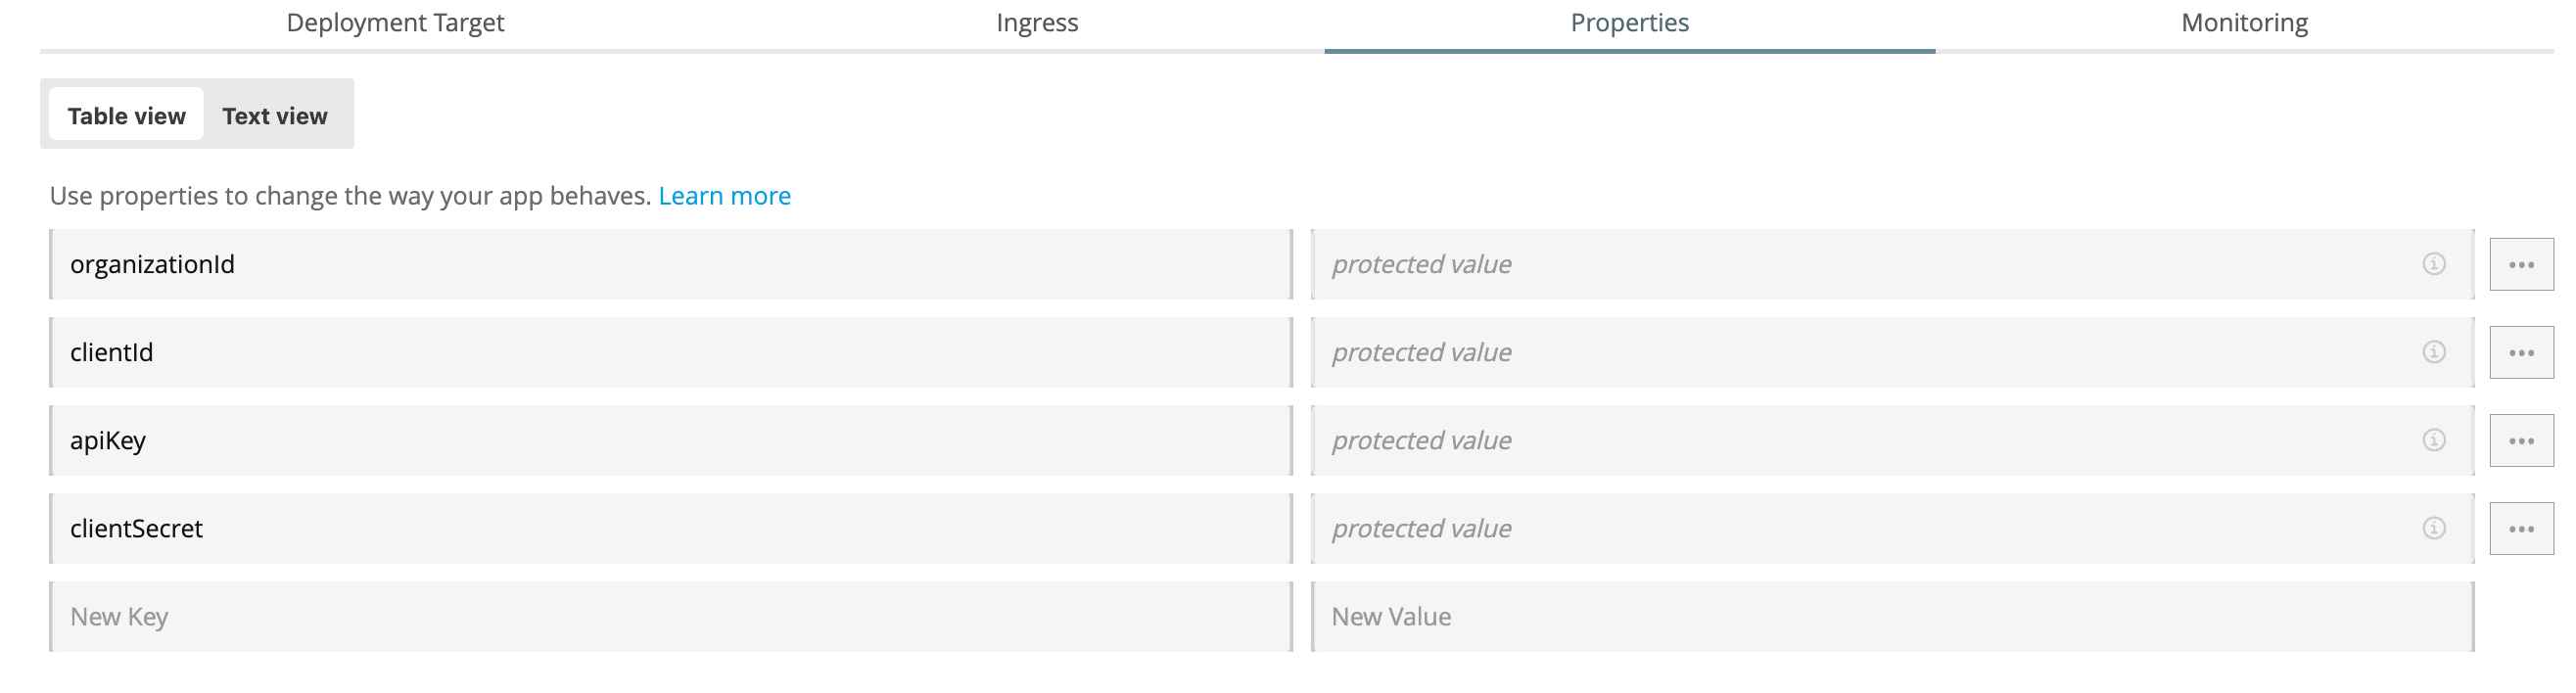
The configuration required these properties:
organizationId: Business group ID (or comma-separated list for multiple groups)
clientId: From the Connected App
clientSecret: From the Connected App
apiKey: Treblle SDK Token
For our multi-group setup, I used: organizationId: group1-id,group2-id,group3-id
The app deployed successfully and started its first scan.
Watching the logs, I could see it working through our environments:
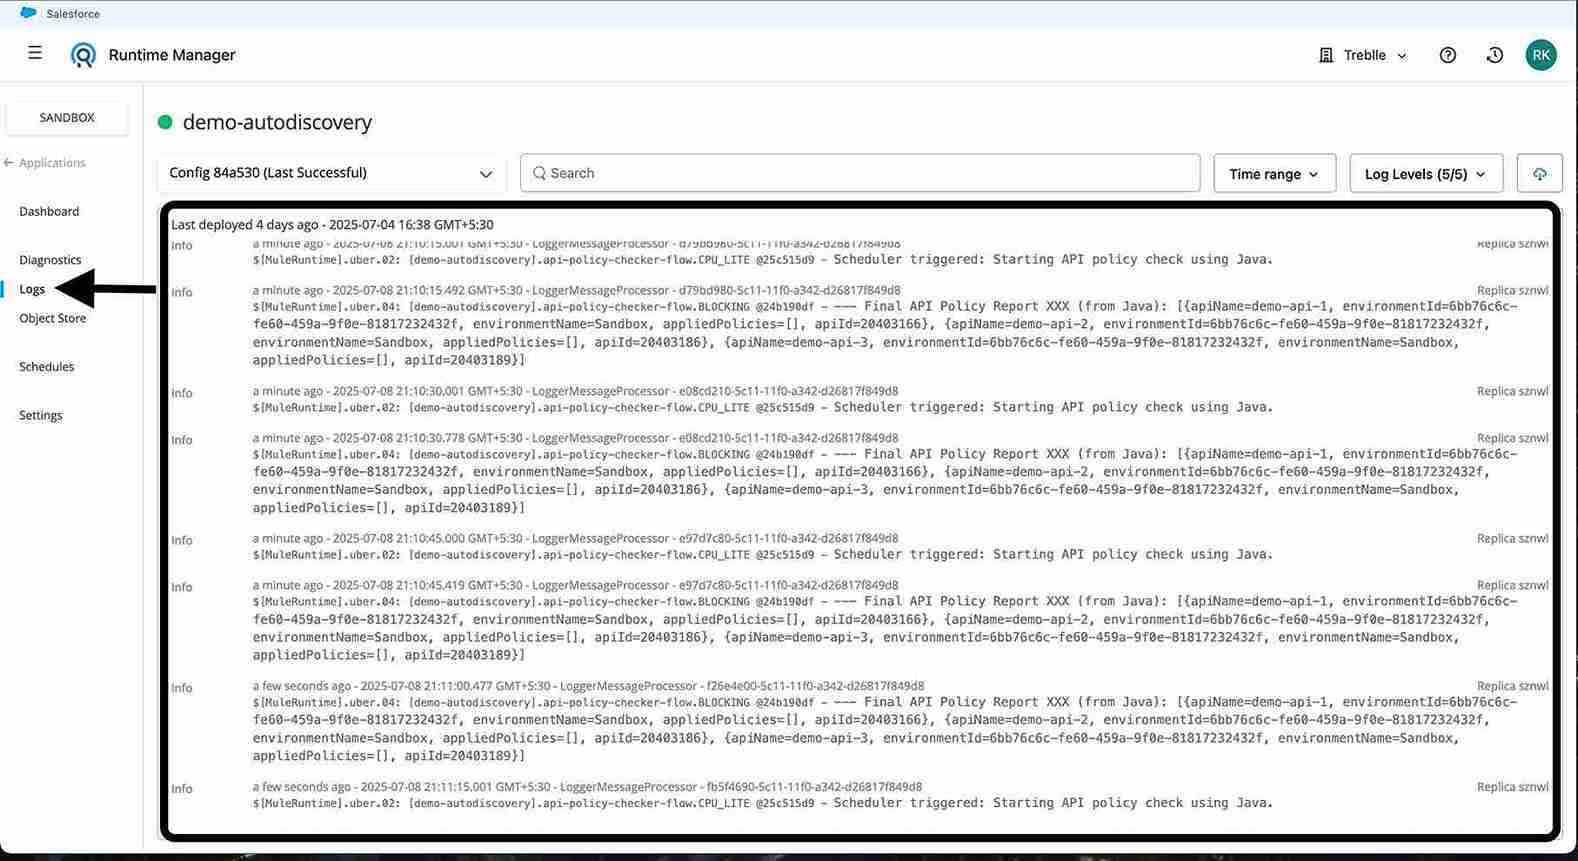
Starting API policy check using Java
Processing environment: Sandbox (ID: 6bb76c6c-fe60-459a-9f0e-818172324327)
API Discovery Summary: 3 APIs with Treblle policies found across 2 organizations
Sending 3 API entries in 1 batches of 20 to third party endpoint
The logs were reassuring, but seeing the complete picture for the first time mattered. The app systematically reviewed each environment and business group, cataloging everything it found.
What surprised me most was discovering APIs I hadn't considered in months.
There were experimental endpoints from hackathons, legacy integrations that teams had abandoned, and even a few APIs handling production traffic that had never been formally documented.
Once the scan was completed, I finally had answers to questions I'd avoided. The Treblle dashboard gave me a clear breakdown of our actual API footprint.
![]()
The data showed me which APIs were genuinely active and which ones were just consuming resources. I could see request patterns, identify APIs critical to our operations, and spot the ones that hadn't been touched in weeks.
Most importantly, I could finally see the monitoring gaps. Some of our most important APIs were unobservable, while others that barely received any traffic were over-monitored.
Need real-time insight into how your APIs are used and performing?
Treblle helps you monitor, debug, and optimize every API request.
Explore TreblleHaving real usage data changed everything. Instead of guessing which APIs mattered, I could make decisions based on traffic patterns and performance metrics.
I found APIs that teams thought were essential but hadn't received a single request in the past month. I also discovered APIs handling critical business functions without monitoring or alerting.
The cost implications became clear too. We were paying for CloudHub resources to run APIs that served no purpose, while under-provisioning APIs that were important to our business.
The Auto-Discovery app runs on a schedule (configurable, but defaults to every few hours). It makes API calls to MuleSoft's management endpoints to retrieve:
All APIs in each environment
Applied policies for each API
Basic configuration and status information
It then packages this data and sends it to Treblle's API discovery endpoint. The process is read-only and lightweight, so it doesn't impact your running APIs.
The biggest win was giving each team visibility into their APIs while maintaining my org-wide view. Teams could see their API health and usage patterns, while I could track coverage and identify gaps.
When new APIs are deployed, they automatically appear in the next scan. There is no more manual tracking or spreadsheet updates.
A few things that tripped me up initially:
Scope Permissions: My first Connected App attempt failed because I missed some required scopes. The app logs were clear about this, making it easy to fix.
Business Group Configuration: Getting multiple business groups working required careful attention to scope permissions. Each group needs identical permissions, not just inclusion in the list.
First Run Performance: Initial discovery took longer because it had to process our entire API inventory. Subsequent runs are much faster since they only check for changes.
If you want to set this up in your environment:
Create a Connected App with proper scopes for all business groups
Download the Auto-Discovery JAR from the Treblle repository
Deploy to Runtime Manager with your organization and Treblle credentials
Monitor the first scan through application logs
Review discovered APIs in your Treblle dashboard
Apply monitoring policies to any unmonitored APIs you want to track
The setup takes about 15 minutes, but the ongoing value is significant. You'll finally know what's running in your MuleSoft environment and can make data-driven decisions about your API portfolio.
Auto-Discovery is the foundation, but the real power comes from combining it with proper monitoring policies. You get both the complete inventory and detailed observability data for the APIs that matter.
This setup scales naturally as your organization grows. New teams can deploy APIs knowing they'll automatically appear in the discovery process, and you maintain visibility without constant manual updates.
The result is a sustainable API governance approach that works in fast-moving development environments.
Need real-time insight into how your APIs are used and performing?
Treblle helps you monitor, debug, and optimize every API request.
Explore TreblleAll Systems Operational
Gartner: Magic Quadrant, 2025
Gartner AI API Strategy, 2025
Everest Group: Enterprise App Integration Platforms, 2026