api-design
How to Scale API Monitoring Across Multiple MuleSoft Environments with Treblle

Summarize with


API sprawl is real.
Your organization starts with a handful of APIs in development, but suddenly, you're managing hundreds of endpoints across production, staging, testing, and sandbox environments. Each business unit spins up its own MuleSoft instances. Before you know it, you've lost track of what APIs exist, which teams actively use them, and whether monitoring policies cover them adequately.
We repeatedly see this challenge with enterprise customers. Teams struggle to maintain visibility across their entire API ecosystem, which spans multiple MuleSoft environments and business groups.
The result?
Security blind spots, unnoticed performance issues, and compliance headaches during audits.
The Multi-Environment Monitoring Challenge
Managing APIs across multiple MuleSoft environments creates several operational problems:
Fragmented Visibility: APIs deployed across different environments often exist in silos. Your development team might have 20 APIs in their sandbox, staging has 15 different versions, and production runs 30 live endpoints.
Without centralized monitoring, you're flying blind.
Policy Inconsistency: Different teams apply different monitoring policies; worse, some APIs run without observability policies. These inconsistencies create gaps in your monitoring coverage, where critical APIs operate without proper oversight.
Manual Discovery Process: Most organizations use manual processes to discover and catalog APIs. This approach doesn't scale when dealing with dozens of environments and hundreds of APIs.
Compliance Reporting: When audit time comes, gathering API usage data across multiple environments becomes a nightmare of spreadsheets and manual data collection.
The traditional approach of manually applying monitoring policies to each API simply doesn't work at scale. You need an automated solution to discover APIs across your entire MuleSoft ecosystem and provide unified monitoring.
Treblle solves this problem through two complementary components that work together to provide complete API visibility:
The Treblle policy acts as your monitoring foundation.
It captures detailed API traffic data including request payloads, response data, performance metrics, and error information. The policy integrates directly into MuleSoft's policy framework, ensuring minimal performance impact on your APIs.
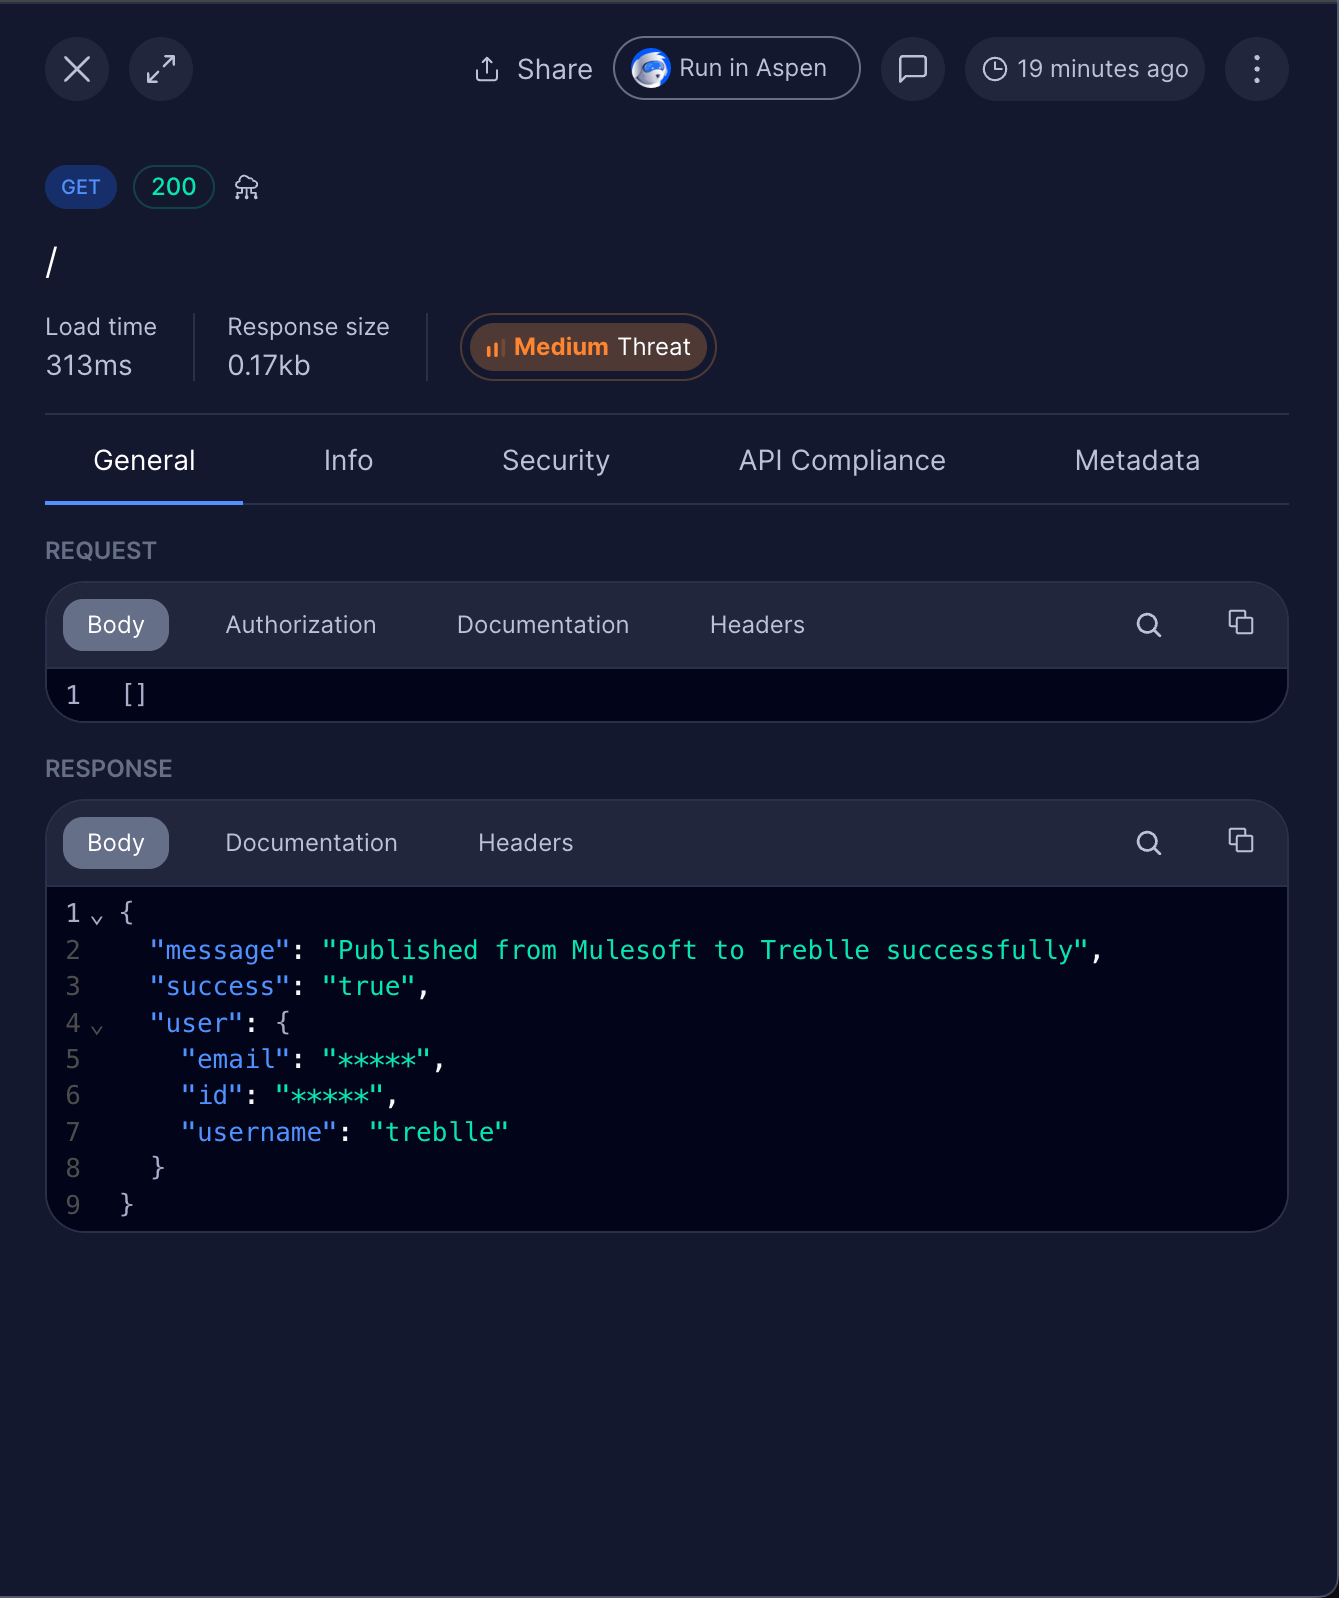
The auto-discovery application is where the magic happens for multi-environment scaling.
This MuleSoft application automatically scans your entire organization for APIs across all environments and business groups and registers them with Treblle for monitoring.
Here's how it works:
Environment Scanning: The application connects to your Anypoint Platform using secure credentials and systematically scans every environment in your organization
API Discovery: For each environment, it identifies all deployed APIs and checks which ones have monitoring policies applied
Automated Registration: APIs with Treblle policies are automatically registered in your Treblle dashboard with proper environment tagging
Continuous Monitoring: The process runs on a schedule, ensuring new APIs are discovered and monitored without manual intervention
Start by deploying the Treblle policy to your MuleSoft Exchange. This deployment creates a reusable monitoring component that can be applied across all environments.
The policy handles:
Request and response capture
Performance timing
Error tracking
Payload masking for sensitive data
Automatic data transmission to Treblle
For multi-environment monitoring, you need to set up proper access across your MuleSoft business groups:
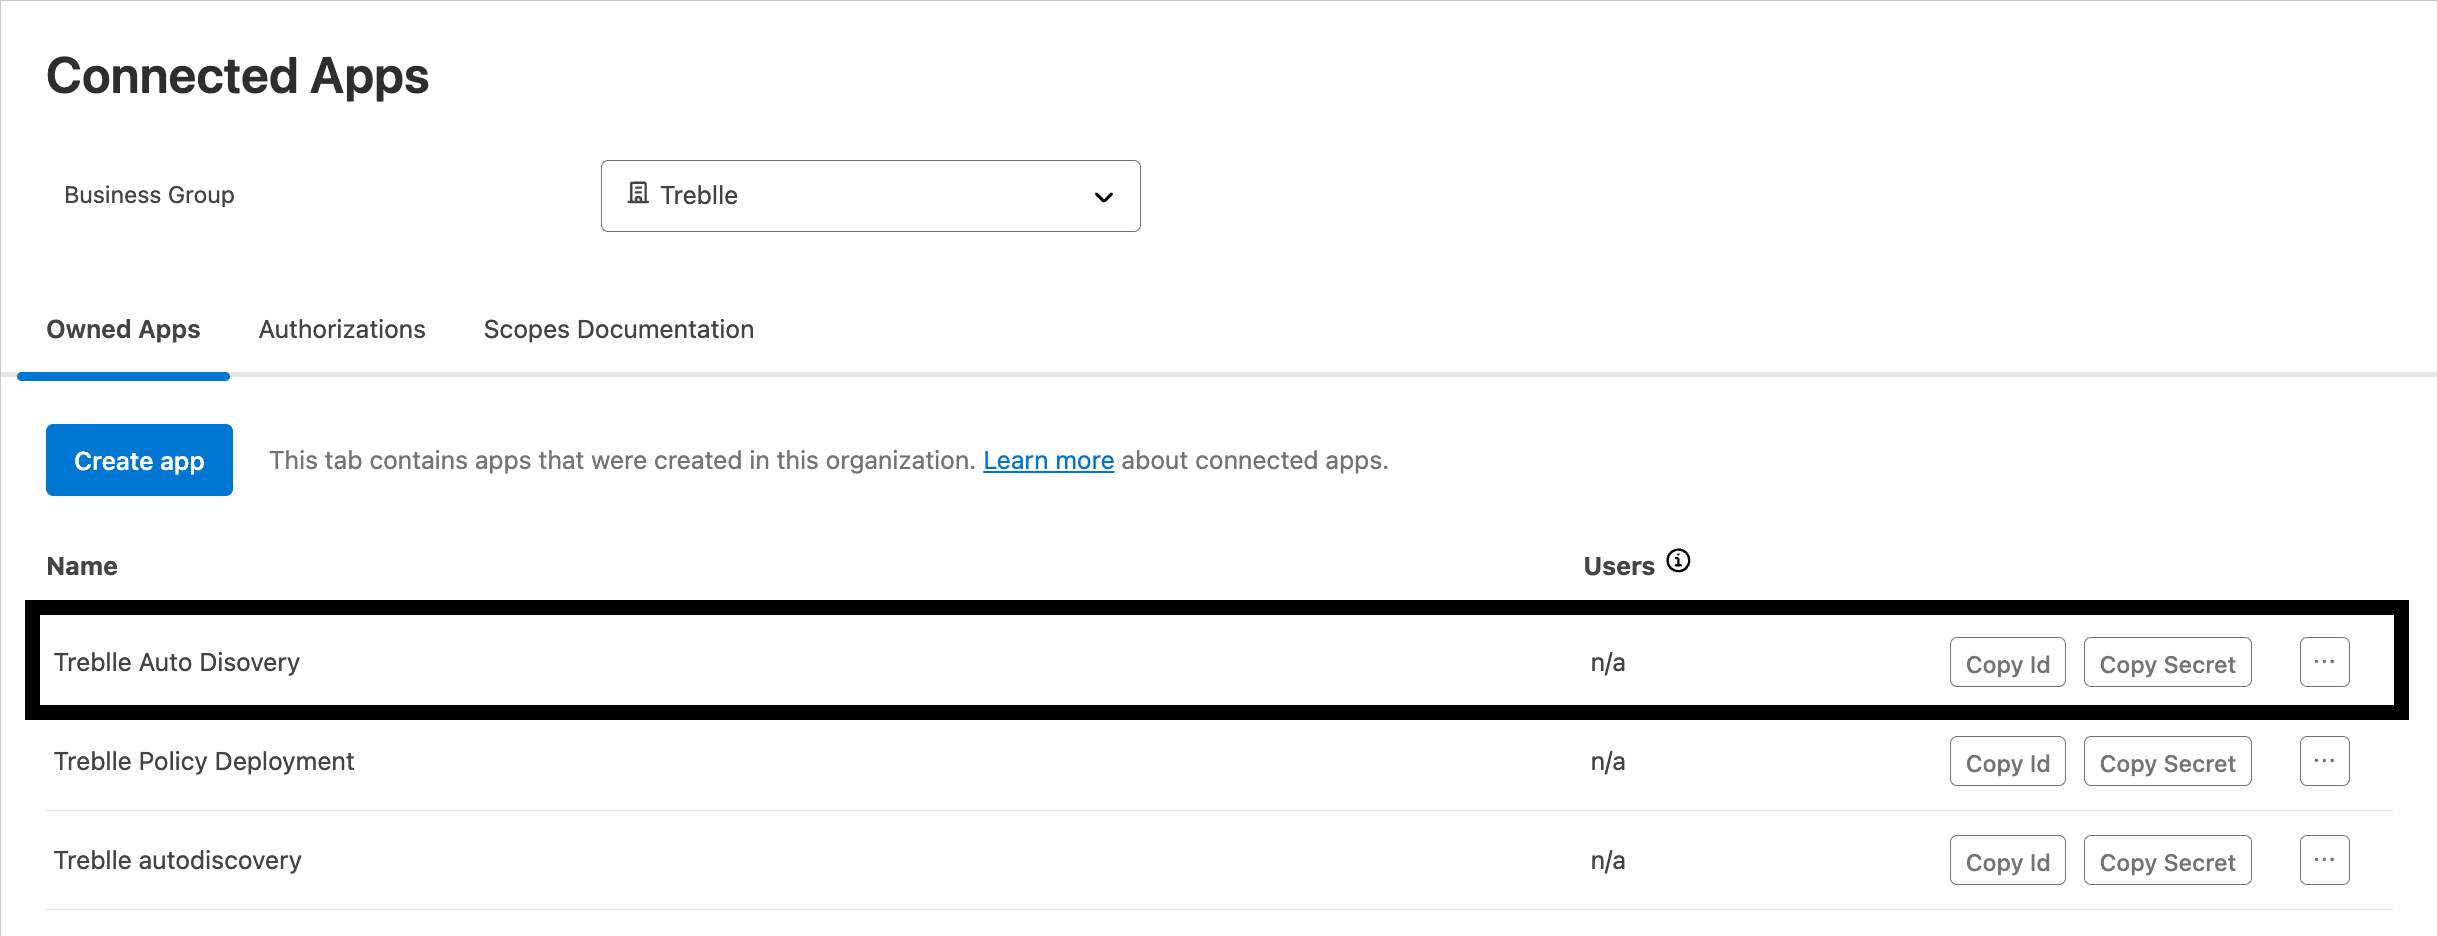
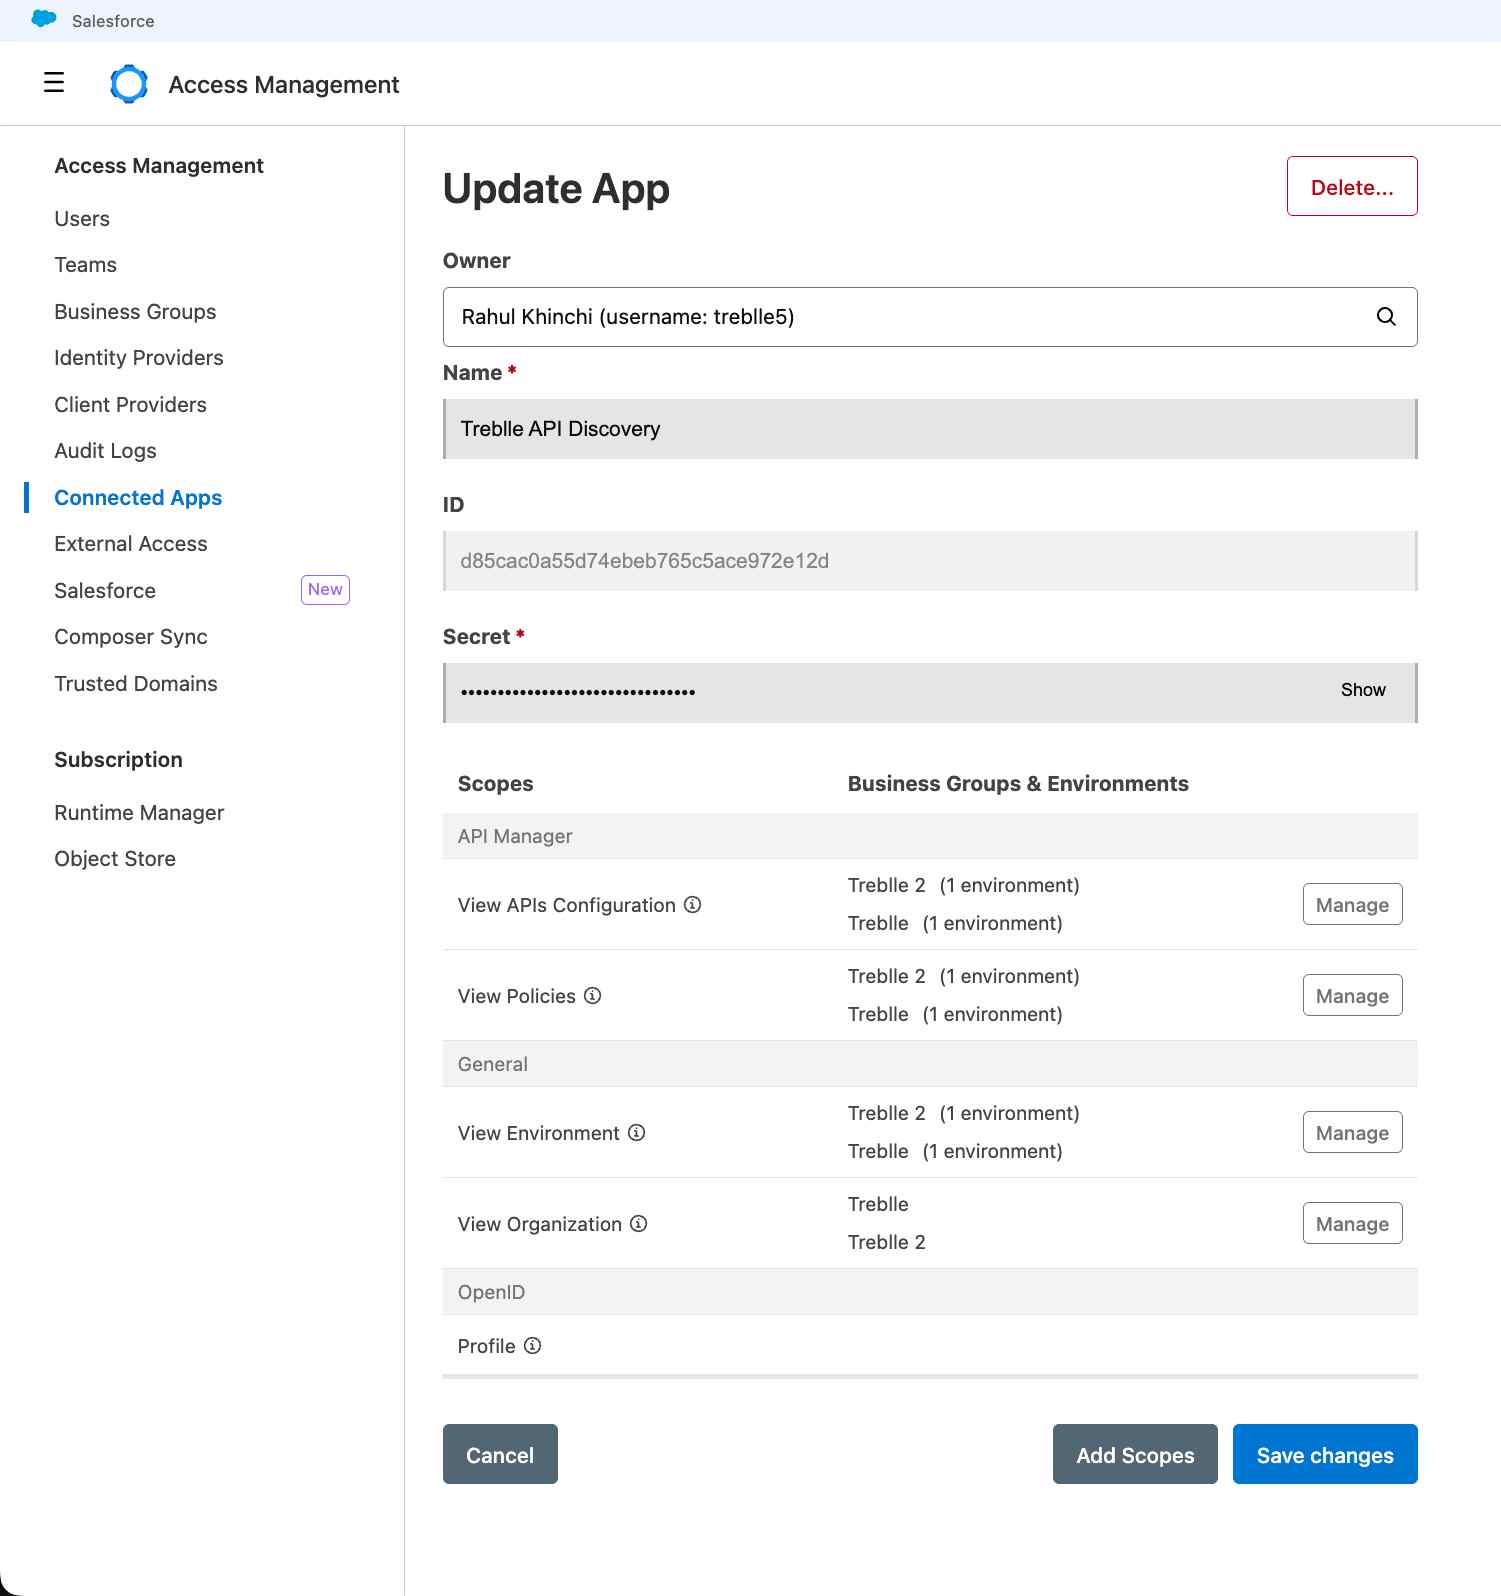
Create Connected App: Set up a connected app in Anypoint Platform with appropriate scopes across all business groups you want to monitor
Configure Permissions: Ensure the connected app has read access to API Manager and Exchange across all relevant business groups
Business Group IDs: Collect the business group IDs for each environment you want to monitor
The auto-discovery application supports monitoring multiple business groups by accepting comma-separated business group IDs in its configuration.
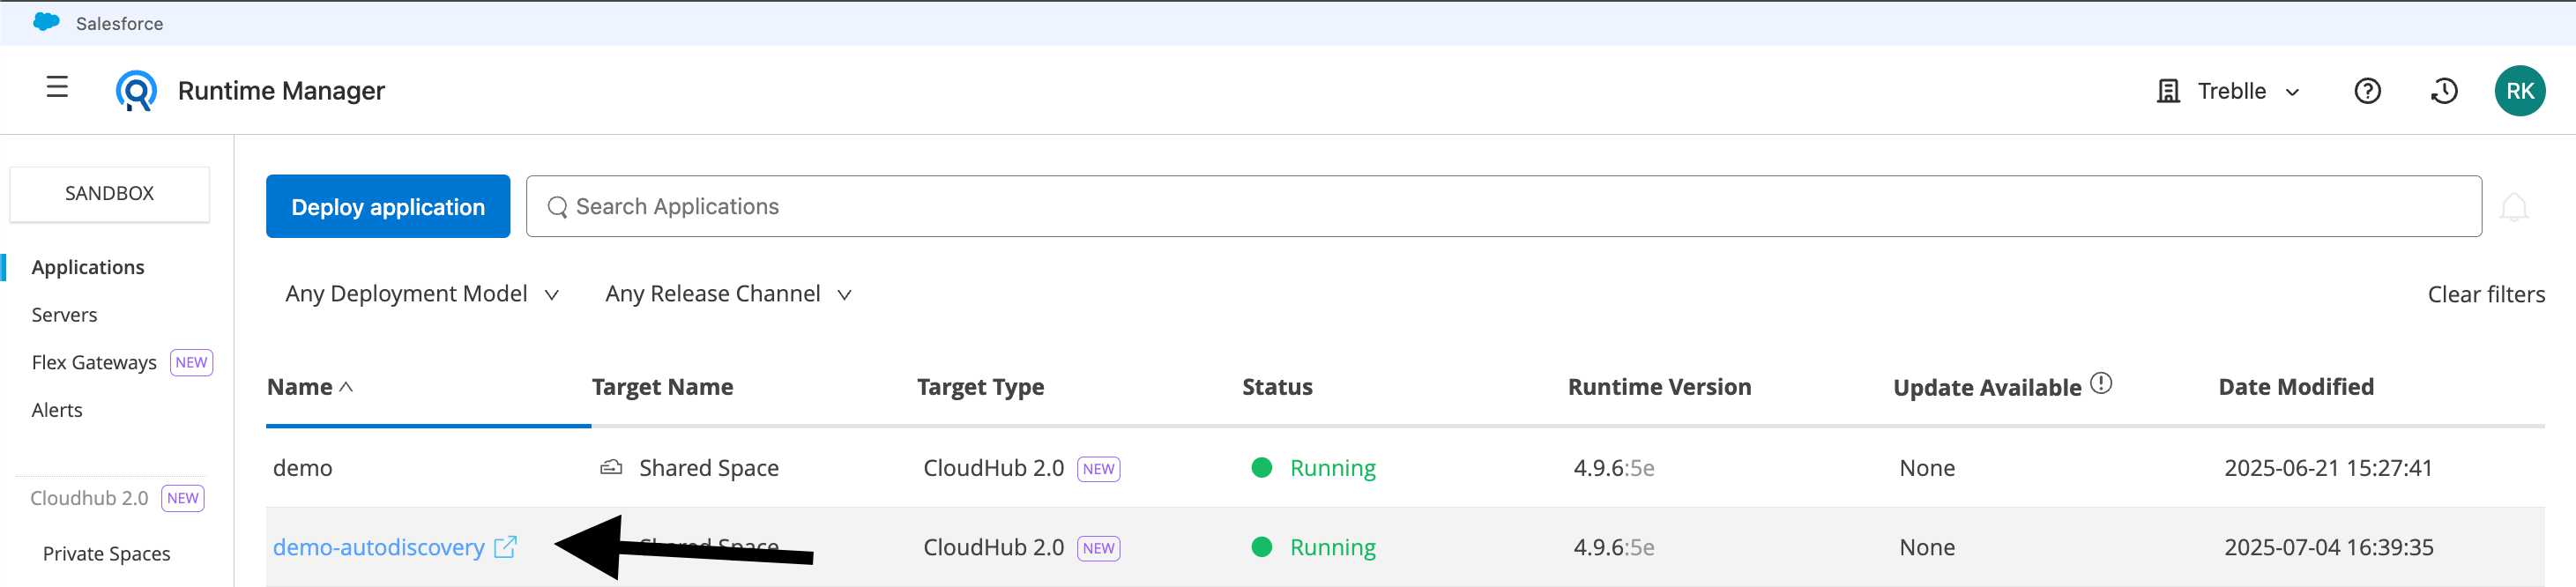
Deploy the Treblle auto-discovery application to Runtime Manager. This application will handle the automated scanning and registration process:
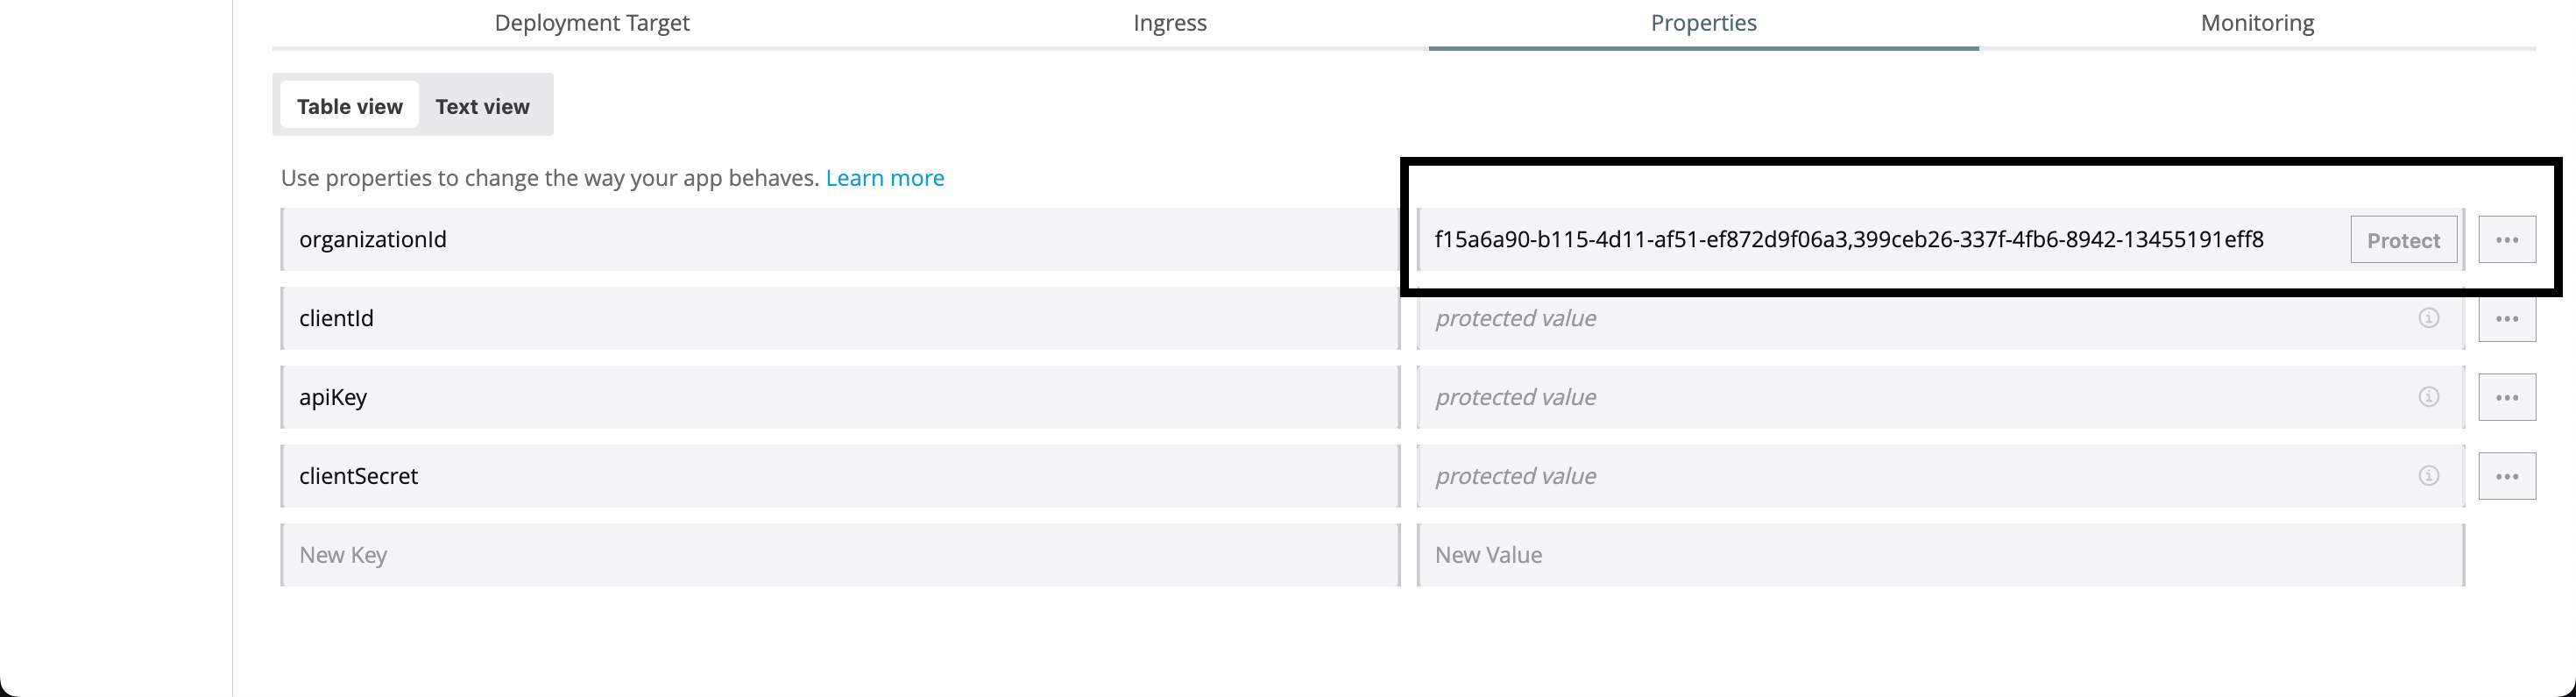
Configuration Properties:
- CLIENT_ID: Your Connected App Client ID
- CLIENT_SECRET: Your Connected App Client Secret
- API_KEY: Your Treblle API Key
- SDK_TOKEN: Your Treblle SDK Token
- OrganizationId: business-group-1-id,business-group-2-id,business-group-3-id
The application runs on a configurable schedule (default: daily) and automatically discovers new APIs across all specified business groups.
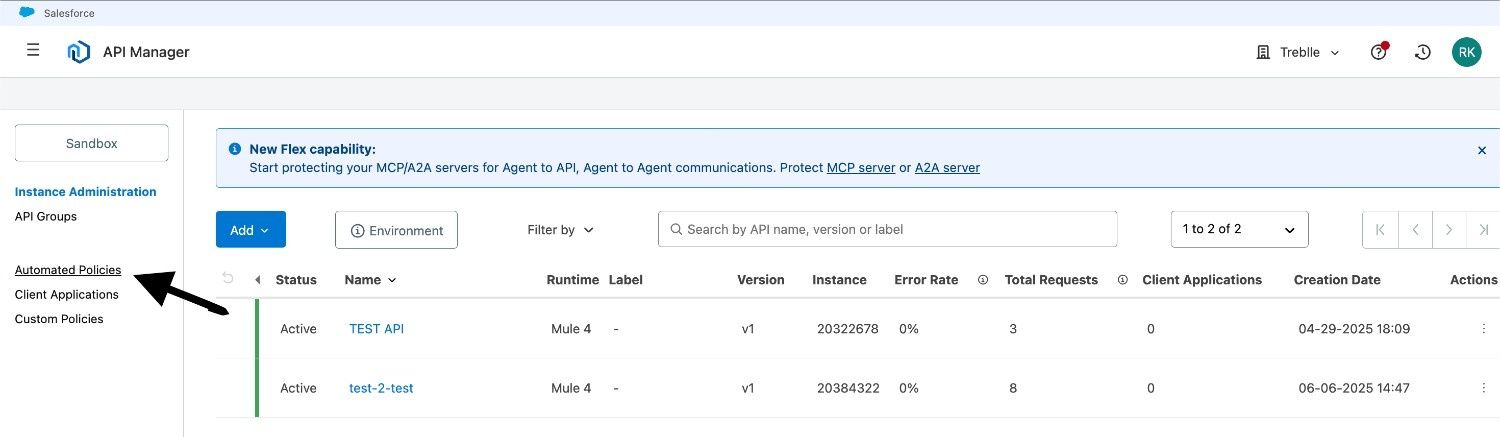
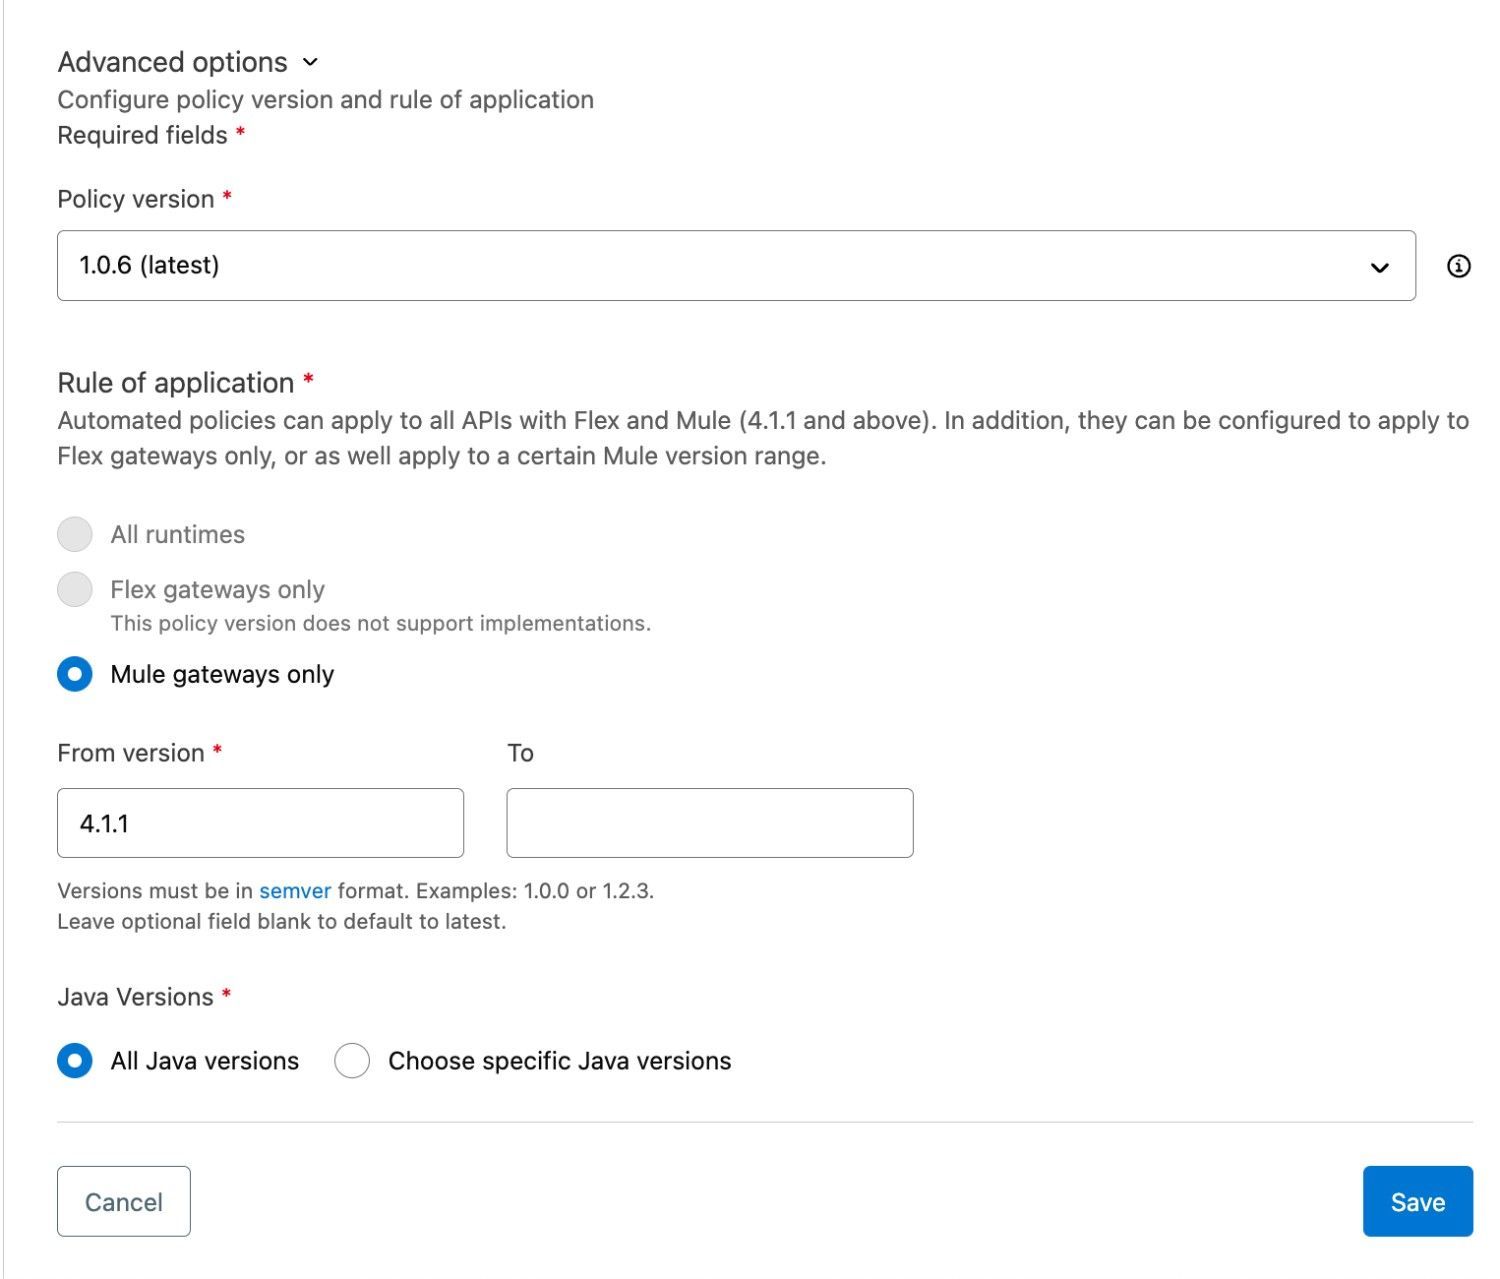
Rather than manually applying the Treblle policy to each API, use MuleSoft's Automated Policies feature. This automated approach ensures consistent monitoring across all APIs in your environments:
Create Automated Policy Rule: Set up a computerized policy in API Manager that applies the Treblle policy to all APIs matching your criteria
Configure Scope: Set the rule to apply across all business groups and runtime types you want to monitor
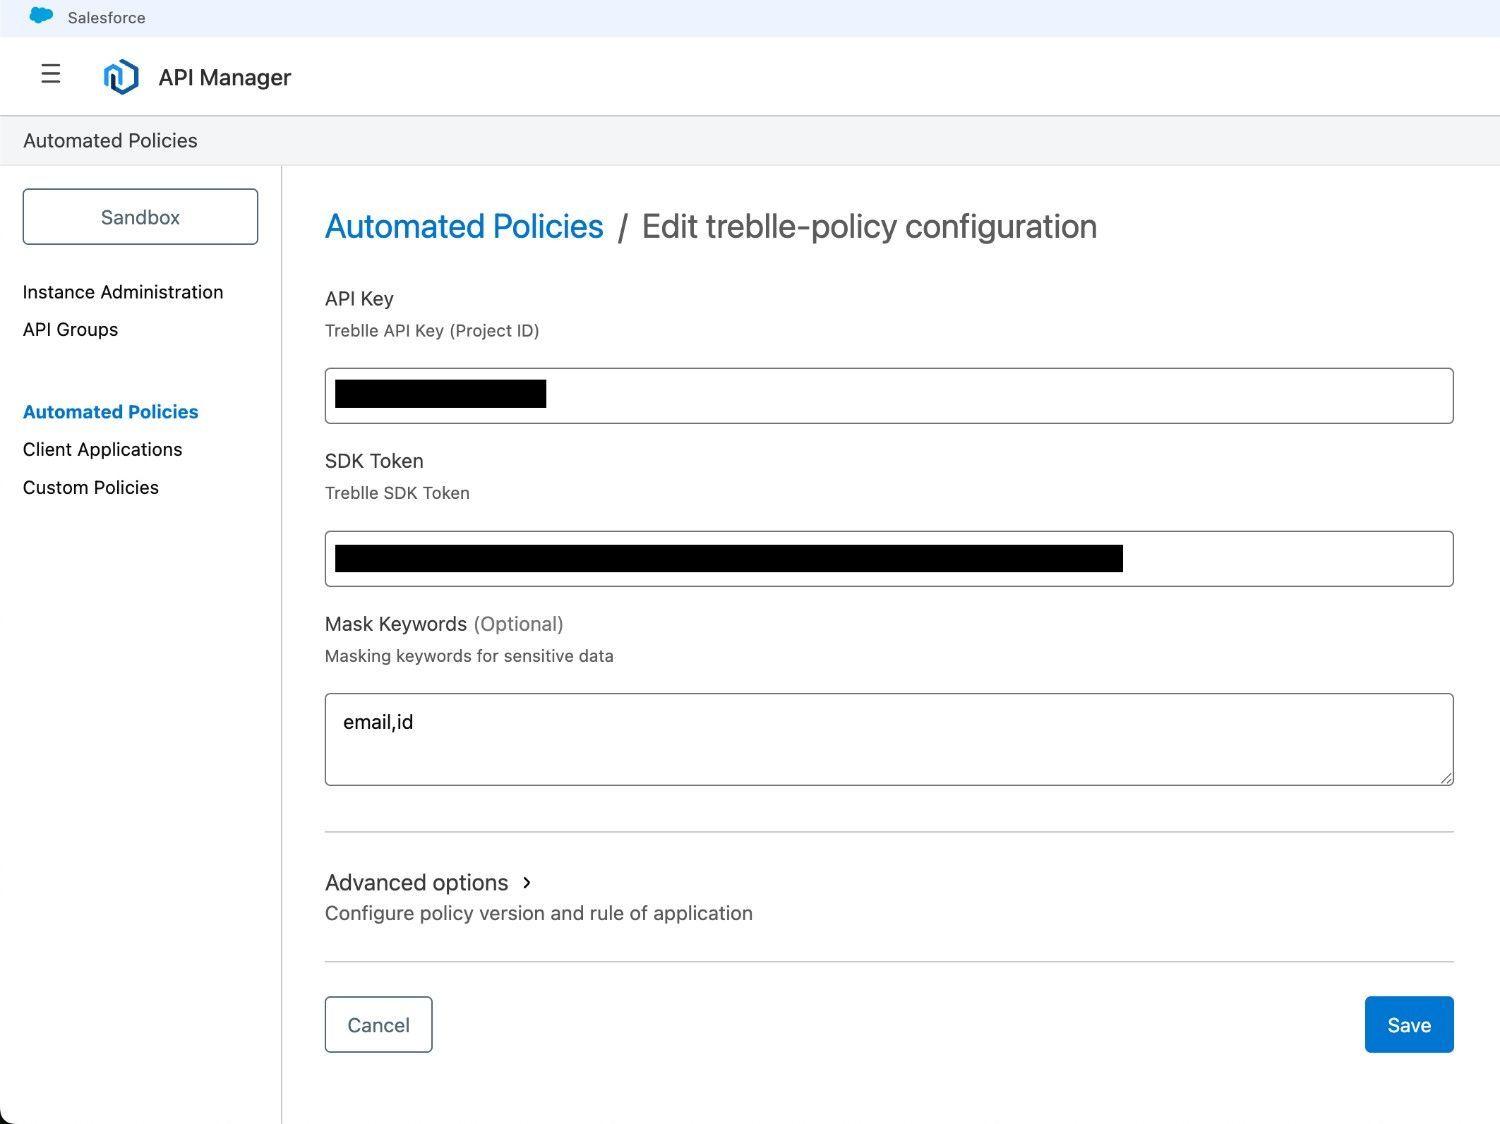
Policy Parameters: Configure the Treblle policy with your API key, SDK token, and any masking rules
This approach ensures that every new API deployed to your environments automatically enables monitoring.
Organize your monitoring by environment types:
Development/Testing: Use basic monitoring with full payload capture for debugging
Staging: Enable performance monitoring and error tracking
Production: Full monitoring with sensitive data masking%3B-,Masking%20sensitive%20information,-Treblle%20masks%20sensitive) and alerting
Configure different Treblle projects for each environment type to maintain proper separation of concerns.
For organizations with multiple business units:
Separate Projects: Create dedicated Treblle projects for each business unit
Access Controls: Use different API keys for each business unit to maintain data isolation
Custom Masking: Apply business-unit-specific data masking rules based on their compliance requirements
Combine automated discovery with selective, detailed monitoring:
Baseline Monitoring: Use automated policies for basic monitoring across all APIs
Enhanced Monitoring: Manually configure detailed monitoring for critical APIs
Selective Masking: Apply different masking levels based on API classification
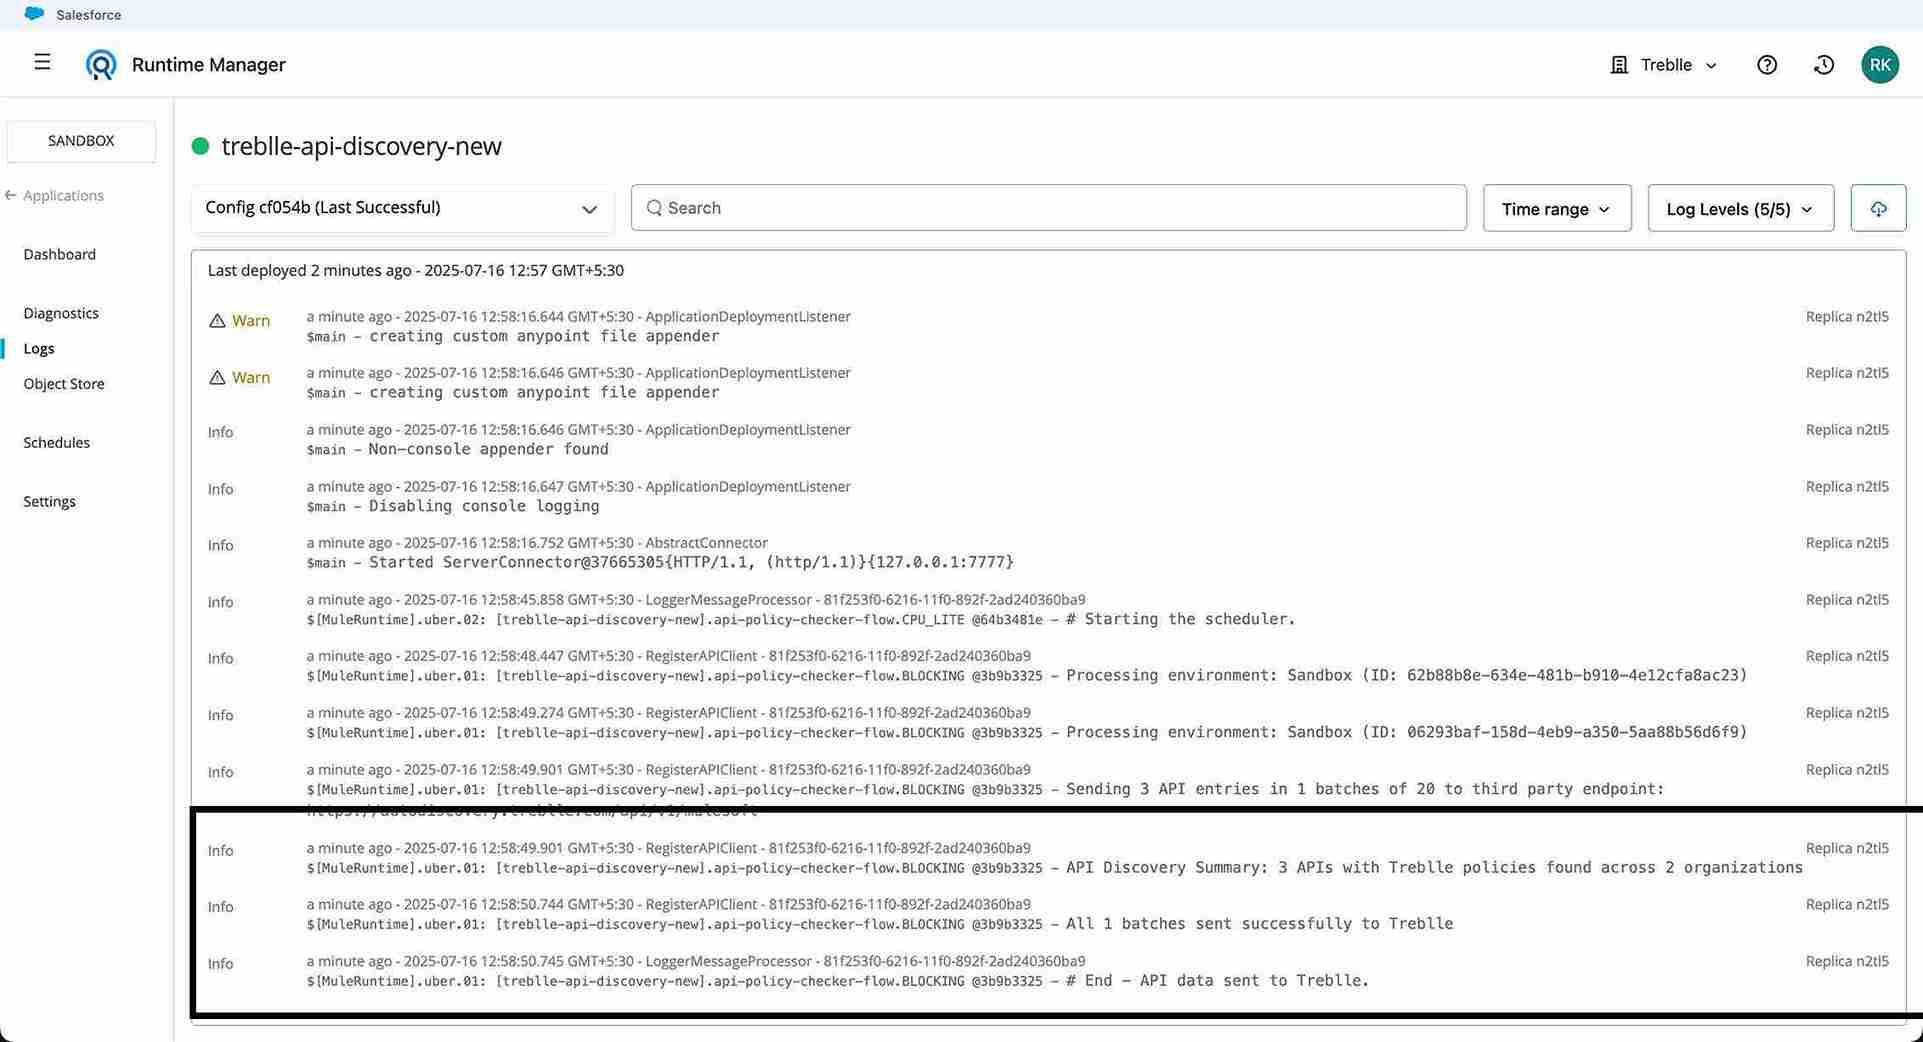
Monitor the health of your auto-discovery application through:
Application Logs: Review logs in Runtime Manager to ensure successful API discovery
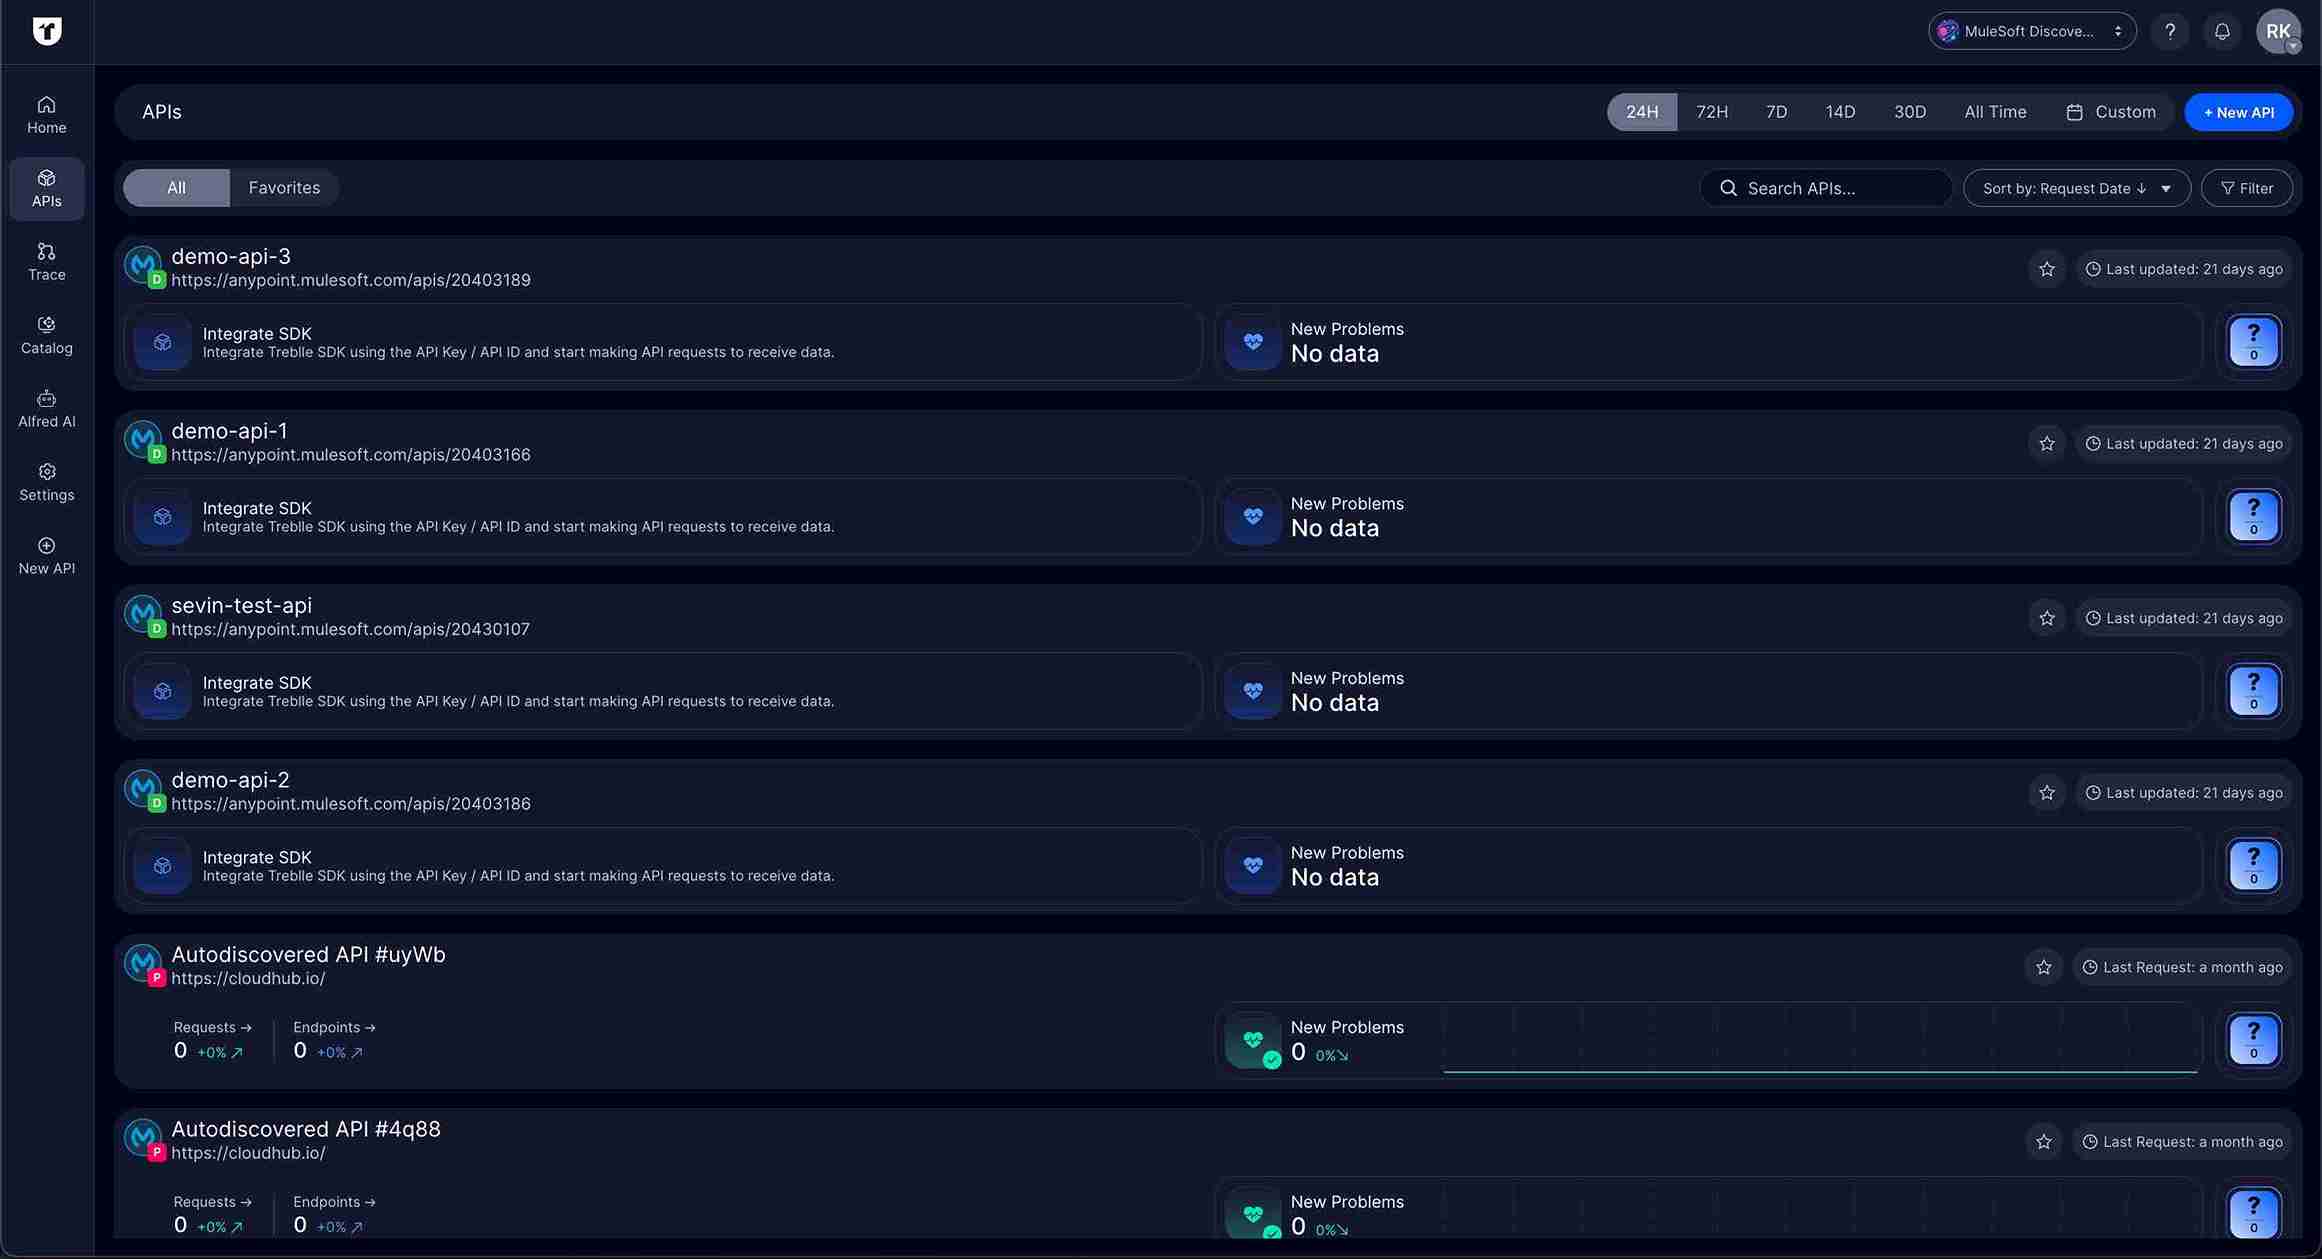
Treblle Dashboard: Verify that new APIs appear in your dashboard within expected timeframes
Coverage Reports: Conduct regular audits to ensure you properly monitor all APIs
The auto-discovery application achieves minimal impact through its design:
Efficient API Calls: Uses pagination and filtering to minimize Anypoint Platform API usage
Asynchronous Processing: Policy data transmission happens asynchronously to avoid affecting API response times
Configurable Schedule: Adjust discovery frequency based on your deployment patterns
Need real-time insight into how your APIs are used and performing?
Treblle helps you monitor, debug, and optimize every API request.
Explore Treblle
Missing APIs in Discovery: Check business group permissions and ensure the connected app has proper access across all environments.
Policy Application Failures: Verify that you have correctly configured automated policy rules and that all business group exchanges include the Treblle policy.
Data is Not Appearing in Treblle. Confirm the API key and SDK token configuration and check the application logs for transmission errors.
With automated discovery and monitoring in place, you gain:
Real-time API Inventory: Automatically maintained catalog of all APIs across environments
Usage Analytics: Comprehensive data on API usage patterns across your entire ecosystem
Performance Baseline: Historical performance data to identify trends and anomalies
Error Tracking: Centralized error monitoring across all environments and business units
Automation reduces manual overhead:
Zero-Touch Monitoring: New APIs are automatically discovered and monitored
Consistent Policy Application: Automated policies ensure uniform monitoring standards
Reduced Configuration Drift: Centralized policy management prevents environment-specific inconsistencies
Streamlined Reporting: Unified dashboards for cross-environment API analytics
Automated monitoring supports governance requirements:
Audit Trail: Complete history of API requests and responses for compliance reporting
Data Classification: Automated masking of sensitive data based on configured rules
Access Monitoring: Track API access patterns across environments
Policy Compliance: Ensure all APIs meet organizational monitoring standards
To implement automated multi-environment monitoring with Treblle:
Assessment: Audit your current MuleSoft environments and identify all business groups that need monitoring
Permissions Setup: Configure connected apps with appropriate cross-environment access
Policy Deployment: Deploy the Treblle policy to all relevant MuleSoft Exchanges
Auto-Discovery Setup: Deploy and configure the auto-discovery application
Automated Policies: Configure automated policy rules for consistent monitoring
Validation: Verify that the system discovers and monitors APIs correctly
The key to successful scaling is starting with a solid foundation and gradually expanding coverage. Begin with one business group or environment, validate the monitoring setup, then systematically extend to additional environments.
Multi-environment API monitoring doesn't have to be complex.
With Treblle's automated discovery and policy framework, you can achieve complete visibility across your MuleSoft ecosystem while maintaining the operational efficiency your organization needs to scale.
All Systems Operational
Gartner: Magic Quadrant, 2025
Gartner AI API Strategy, 2025
Everest Group: Enterprise App Integration Platforms, 2026