api-design
A comprehensive guide to observability and monitoring with .NET Minimal APIs

Summarize with


Deployed a sleek, high-performance API, only to find yourself baffled by issues later on?
APIs often become black boxes, obscuring problems from view. Harness the power of observability and monitoring to overcome these challenges.
So far you have learned how to:
As a finale to this series, we'll integrate an observability and monitoring tool to prevent unexpected behavior in our API.
And in case you're wondering if I meant multiple tools instead of just one, I did not. There's one tool that reigns supreme.
But before unveiling that tool, let's delve into the concepts mentioned in the title:
Need real-time insight into how your APIs are used and performing?
Treblle helps you monitor, debug, and optimize every API request.
Explore Treblle
Observability entails grasping the internal state of a system through its output. It involves gaining insights into system performance and behavior without directly accessing its internals.
A prime paradigm for observability is the black box model. While you're aware that activity is occurring within, the internal workings remain hidden. However, you can interpret the internal state based on the output received.
The three pillars of observability are:
To maximize these pillars, it’s essential to use the right tools. Check out our guide on the top API observability tools for 2024 to explore the best options available.
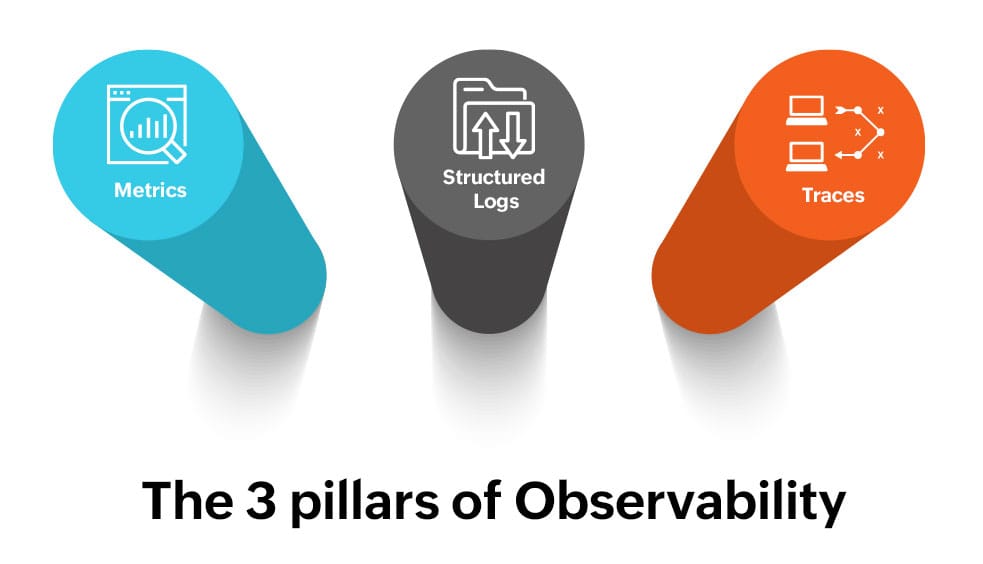
The three pillars of observability
Upon collecting this telemetry, the platform promptly correlates it in real-time. The greater the observability of your system, the more effectively you can:
For a more in-depth understanding of observability, check out this comprehensive resource on mastering API health and observability.
Monitoring is a continuous process that involves collecting and analyzing data to track system performance, health, and behavior.
One of the most prominent monitoring tools today is the smartwatch. With its capabilities, you can measure various vital signs, such as blood pressure, saturation levels, and sleep quality, among others.
Breaking down the steps of smartwatch monitoring, it typically involves:
For a comprehensive exploration of observability, delve into this blog.
If you interchange observability and monitoring, you're not alone—I've done it too, along with countless others.
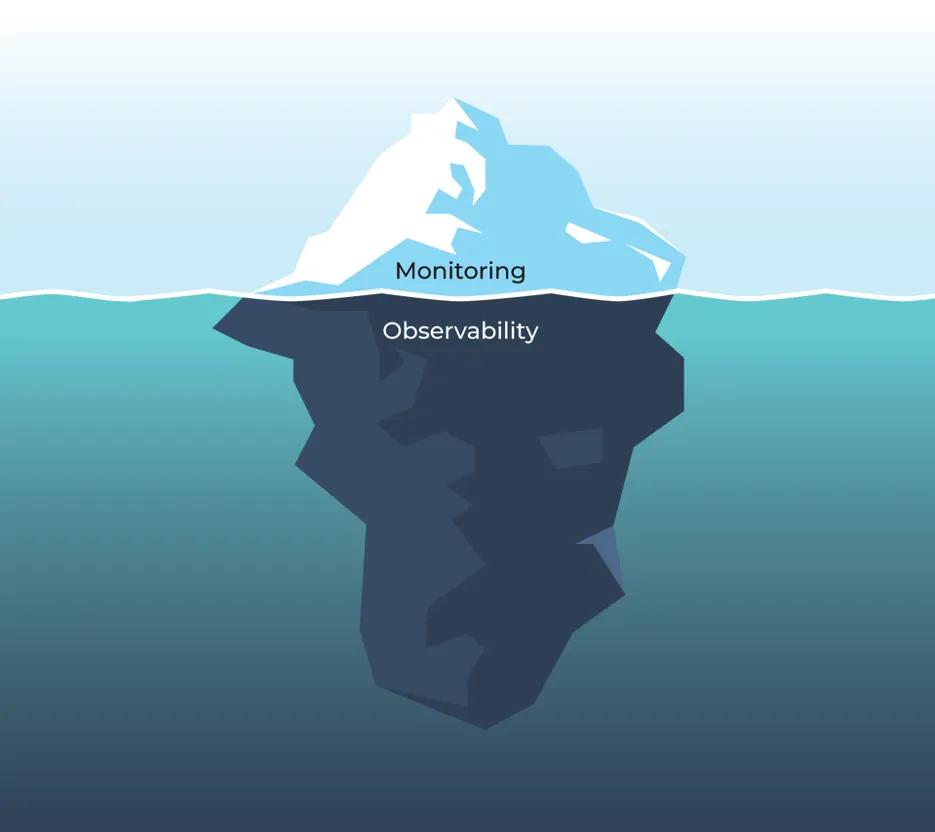
To be frank, observability and monitoring initially appear as "two sides of the same coin."
However, there's a crucial distinction between them.
The key difference lies in the fact that observability relies on monitoring. Put simply, monitoring establishes the groundwork, and observability expands upon it.
To explore the nuances between observability and monitoring, take a look at this detailed API Observability vs API Monitoring article.
Now that you're acquainted with the concepts and their disparities, let's kickstart the implementation.
To follow along, ensure you have:
Once the setup is complete, proceed to create a Minimal API solution.
In previous examples, we utilized an in-memory collection.
However, this time, we'll switch to a database approach. For the sake of simplicity, I'll opt for SQLite.
Setting up is straightforward.
First, let's add the entity.
public class User
{
    public int Id { get; init; }
    public string Firstname { get; set; }
    public string Lastname { get; set; }
    public DateOnly Birthdate { get; set; }
    public string Username { get; set; }
    public string Email { get; set; }
}
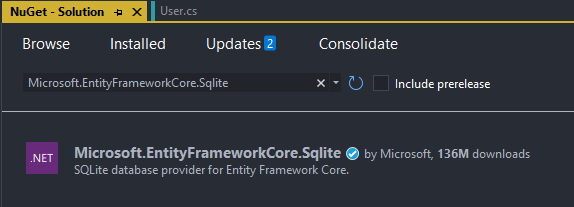
Now, add an EF Core database provider for SQLite.
In Visual Studio, navigate to Tools > NuGet Package Manager > Manage NuGet Packages for Solution.
In the search bar, type Microsoft.EntityFrameworkCore.Sqlite and install it.
Now, let's configure the DbContext with a Users DbSet and seed data.
public class PlaygroundContext(DbContextOptions options) : DbContext(options)
{
    public DbSet<User> Users { get; init; }

    protected override void OnModelCreating(ModelBuilder modelBuilder)
    {
        var id = 1;

        var fakeUsers = new Faker<User>()
            .RuleFor(m => m.Id, f => id++)
            .RuleFor(m => m.Firstname, f => f.Name.FirstName())
            .RuleFor(m => m.Lastname, f => f.Name.LastName())
            .RuleFor(m => m.Birthdate, f => f.Date.FutureDateOnly())
            .RuleFor(m => m.Username, f => f.Internet.UserName())
            .RuleFor(m => m.Email, f => f.Internet.Email());


        modelBuilder.Entity<User>()
                    .HasData(fakeUsers.GenerateBetween(100, 100));
    }
}
To generate fake data, I utilized the Bogus library, which facilitates fast creation of fictitious data. Learn more about it here.
The final step in setting up the database is to create migrations and execute them against the database.
To create a migration, use the command: dotnet ef migrations add <migration name>. If the migration is successful, you should see a folder named Migrations.
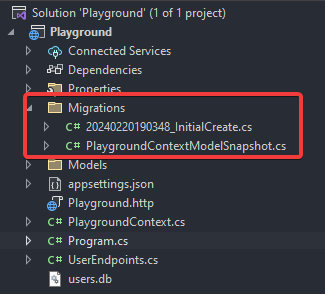
To perform ansigns, update, utilize dotnet ef database update command.
With the database setup complete, proceed to implement straightforward CRUD endpoints.
public static void MapUserEndpoints (this IEndpointRouteBuilder routes)
{
    var group = routes.MapGroup("/api/User")
                      .WithTags(nameof(User));

    group.MapGet("/", async (PlaygroundContext db) =>
    {
        return await db.Users.ToListAsync();
    })
    .WithName("GetAllUsers")
    .UseTreblle()
    .WithOpenApi();

    group.MapGet("/{id}", async Task<Results<Ok<User>, NotFound>> (int id, PlaygroundContext db) =>
    {
        return await db.Users.AsNoTracking()
                             .FirstOrDefaultAsync(model => model.Id == id)
            is User model
                ? TypedResults.Ok(model)
                : TypedResults.NotFound();
    })
    .WithName("GetUserById")
    .WithOpenApi();

    group.MapPut("/{id}", async Task<Results<Ok, NotFound>> (int id, User user, PlaygroundContext db) =>
    {
        var affected = await db.Users
                               .Where(model => model.Id == id)
                               .ExecuteUpdateAsync(setters => setters
                                                   .SetProperty(m => m.Id, user.Id)
                                                   .SetProperty(m => m.Firstname, user.Firstname)
                                                   .SetProperty(m => m.Lastname, user.Lastname)
                                                   .SetProperty(m => m.Birthdate, user.Birthdate)
                                                   .SetProperty(m => m.Username, user.Username)
                                                   .SetProperty(m => m.Email, user.Email));

        return affected == 1 ? TypedResults.Ok() :
                               TypedResults.NotFound();
    })
    .WithName("UpdateUser")
    .WithOpenApi();

    group.MapPost("/", async (User user, PlaygroundContext db) =>
    {
        db.Users.Add(user);

        await db.SaveChangesAsync();

        return TypedResults.Created($"/api/User/{user.Id}",user);
    })
    .WithName("CreateUser")
    .WithOpenApi();

    group.MapDelete("/{id}", async Task<Results<Ok, NotFound>> (int id, PlaygroundContext db) =>
    {
        var affected = await db.Users
                               .Where(model => model.Id == id)
                               .ExecuteDeleteAsync();

        return affected == 1 ? TypedResults.Ok() :
                               TypedResults.NotFound();
    })
    .WithName("DeleteUser")
    .WithOpenApi();
}
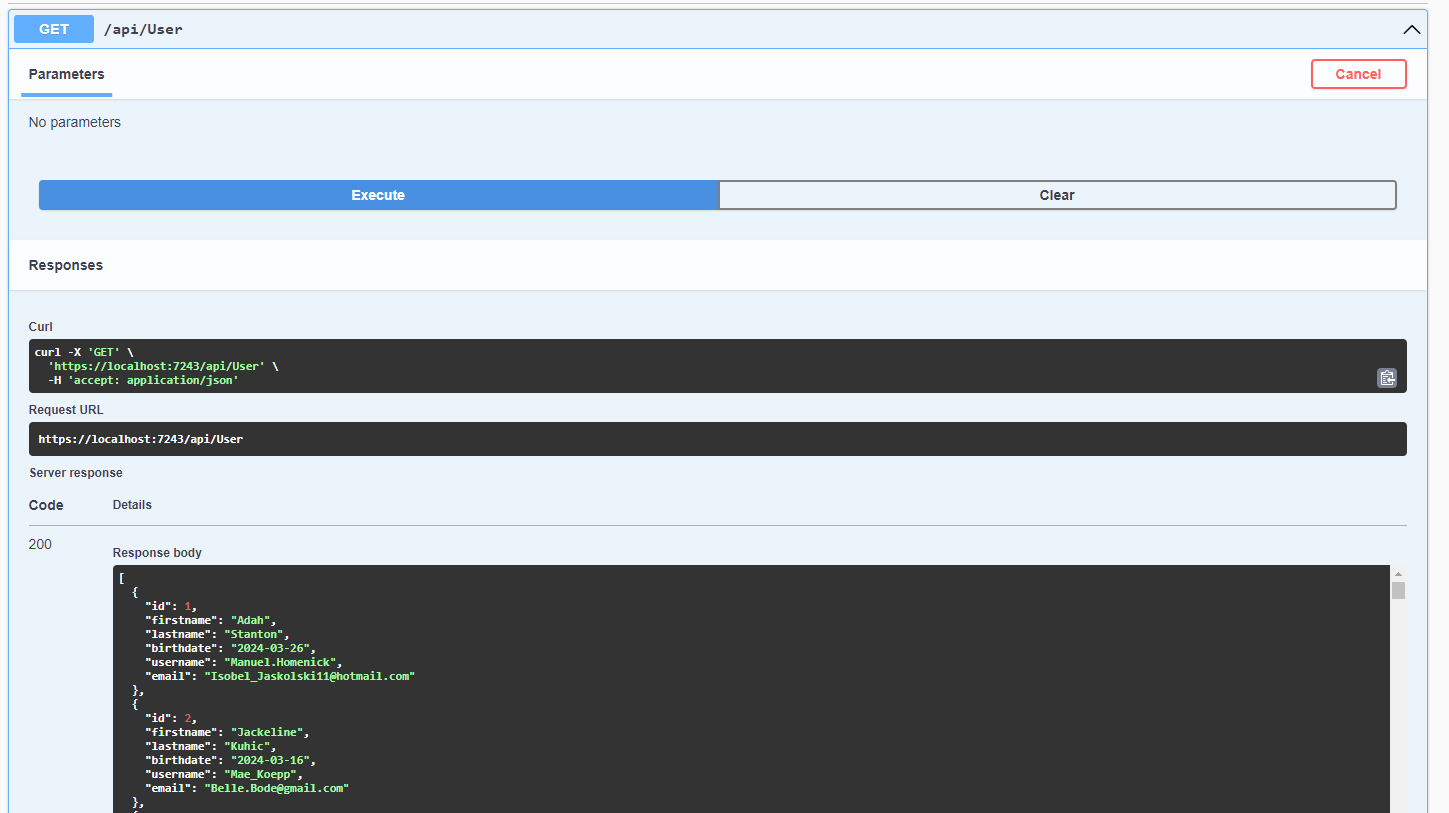
Once completed, run the application and send a request.
API setup is complete. The final step is to integrate monitoring and observability into the application using Treblle.
By now, you've likely deduced that the tool mentioned at the outset is Treblle.
It's a comprehensive platform designed to aid in building, shipping, and comprehending REST APIs seamlessly.
The integration process involves four simple steps:
Let's put these steps into practice!
Need real-time insight into how your APIs are used and performing?
Treblle helps you monitor, debug, and optimize every API request.
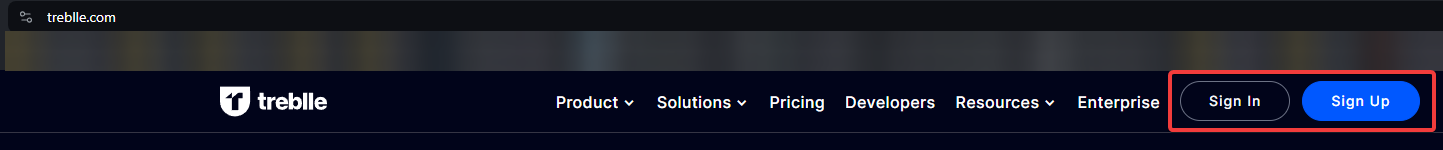
Explore TreblleGo to the Treblle and click the Sign in button,perform an or Sign up if you already have an account.
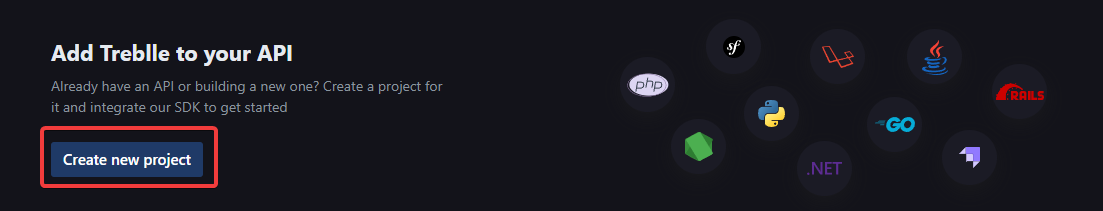
Upon successful login, you'll be redirected to the Dashboard page, where you'll find the Create a project button.
You'll encounter a form where you'll need to input four pieces of information:
Upon submission, you'll be redirected back to the Dashboard, where you'll find integration details.
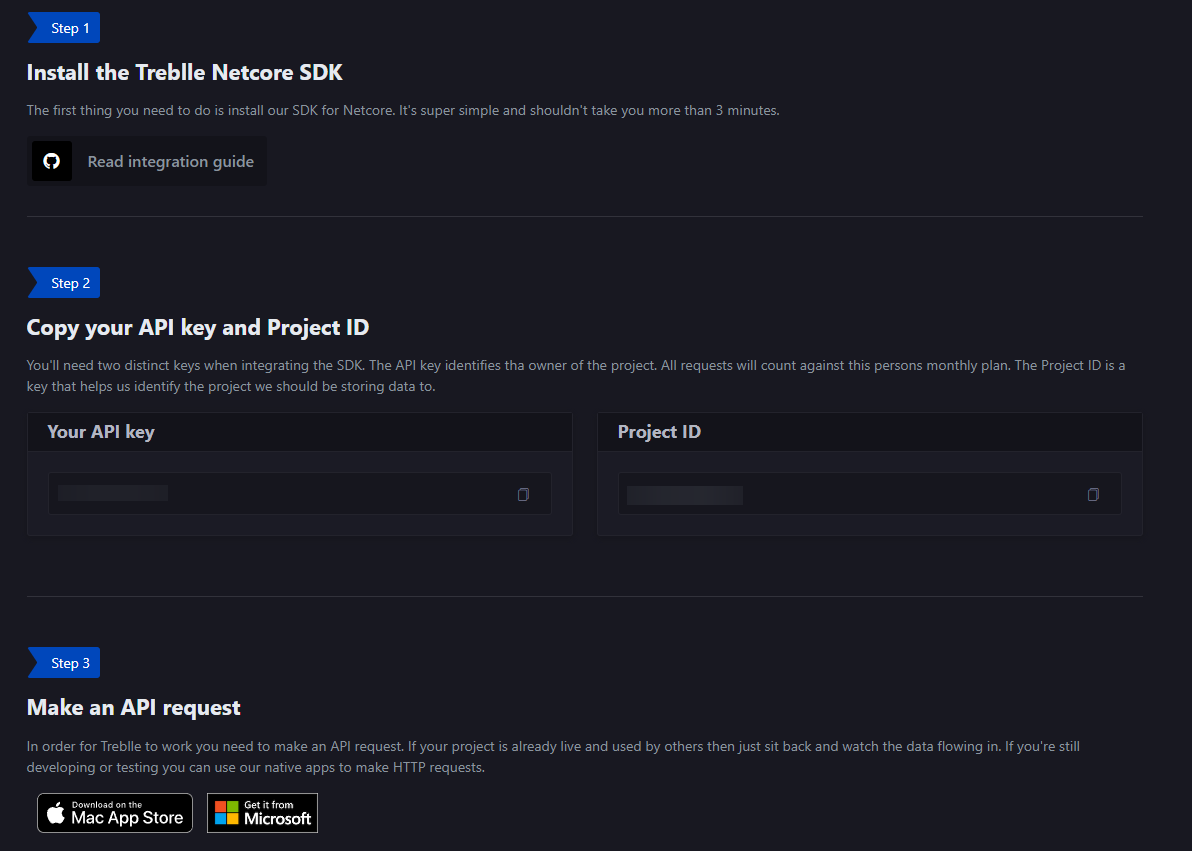
You'll now observe the simplicity of the integration process.
Integrate the corresponding SDK into your application.
![]()
Add the service to the DI container with the API Key and Application ID obtained from the Dashboard, and then include the Treblle middleware.
var builder = WebApplication.CreateBuilder(args);

builder.Services.AddEndpointsApiExplorer()
                .AddSwaggerGen()
                .AddDbContext<PlaygroundContext>(options => options.UseSqlite("DataSource=users.db"));

builder.Services.AddTreblle("<apiKey here>", "<appID here>"); // <-- Add this

var app = builder.Build();

if (app.Environment.IsDevelopment())
{
    app.UseSwagger();
    app.UseSwaggerUI();
}

app.UseHttpsRedirection();

app.MapUserEndpoints();

app.UseTreblle(useExceptionHandler: true); // <-- Add this

app.Run();
Apply the UseTreblle() extension method to the endpoint you wish to monitor.
group.MapGet("/", async (PlaygroundContext db) =>
{
    return await db.Users.ToListAsync();
})
.WithName("GetAllUsers")
.UseTreblle() <-- Add this
.WithOpenApi();
That concludes the integration process!
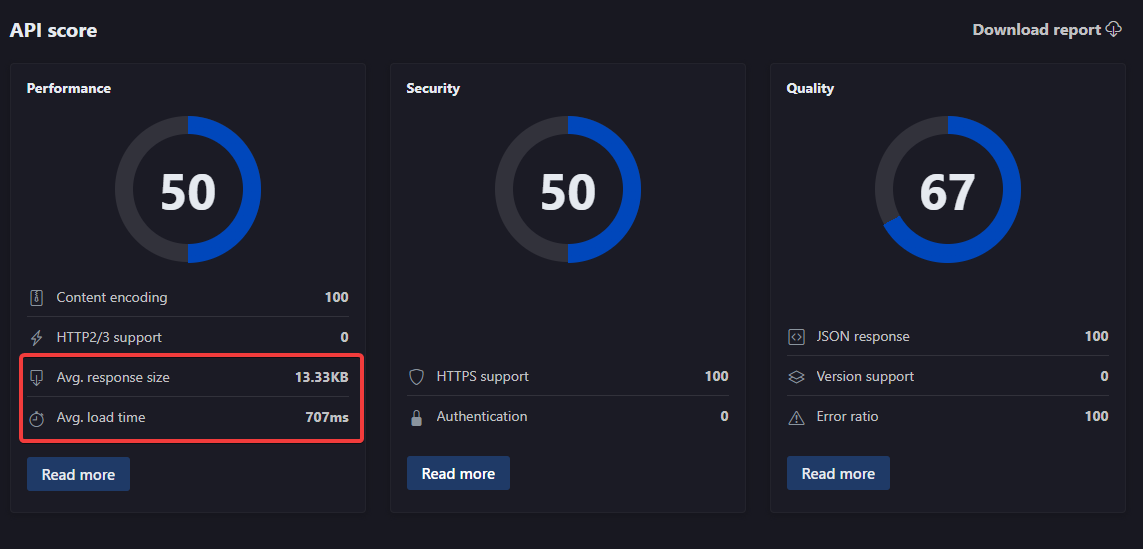
Once you access the endpoint on the dashboard, you should observe something similar to this:
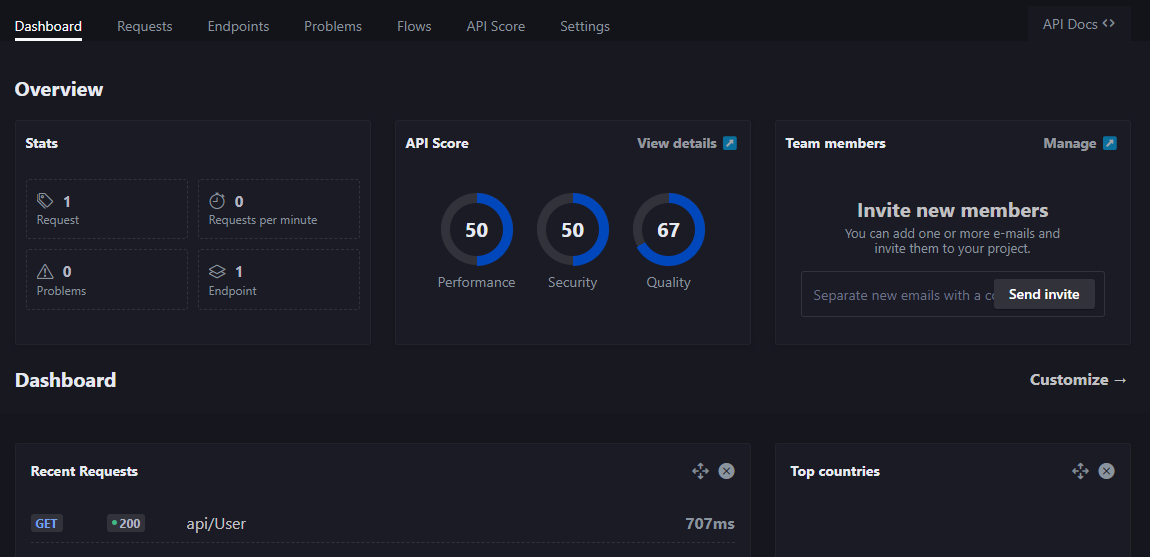
Navigate to the API scorecard and click on view details. This action will open a page displaying three cards:
Within the Performance card, you'll find the relevant metrics.
And this is just the tip of the iceberg.
You can also:
Feel free to explore further.
I assure you, it's worth it.
We've delved deep into the world of observability and monitoring for .NET Minimal APIs and Treblle.
Hopefully, you now have a solid understanding of how to keep your APIs healthy and performant.
As your APIs evolve, so should your monitoring practices.
And adding Treblle to be your main API monitoring tool, you'll unlock benefits like:
Make observability and monitoring key things for APIs, because observability gives you the big picture, allowing you to see and understand what's happening within your APIs.
And monitoring takes it a step further by turning those observations into meaningful data, providing clear metrics and alerts to guide your actions.
Need real-time insight into how your APIs are used and performing?
Treblle helps you monitor, debug, and optimize every API request.
Explore TreblleAll Systems Operational
Gartner: Magic Quadrant, 2025
Gartner AI API Strategy, 2025
Everest Group: Enterprise App Integration Platforms, 2026