api-design
How API Observability will prevent your next API crash

Summarize with


In a perfect world, bugs in your API would all be identified in your development environment or CI/CD pipeline. In reality, customers use your API in ways you can’t predict and even the highest quality code will surface occasional bugs.
API monitoring tools are useful here. You can run scheduled tests to identify problems that may impact customers and instantly alert your engineers.
Where monitoring tools fall down is that they look for problems where you already expect to find them. Truly show-stopping bugs are the ones that arise where you least expect them, however. This is where you need API observability.
In this article, we’re going to take a look at what API observability is, how it makes up for the flaws in traditional API monitoring, and how it even provides user experience and marketing benefits.
We’ll also see why it’s crucial for organizations with scaling ambitions to employ API observability tools.
A typical API monitoring tool will run scheduled test calls on your API endpoints. Your engineers will get a notification via email or Slack if anything unexpected is returned.
API monitoring can also collect performance data that can be presented in a neat dashboard that can provide a report on API health whenever needed.
API monitoring is considered a “black box” approach since testing is conducted from outside of your system.
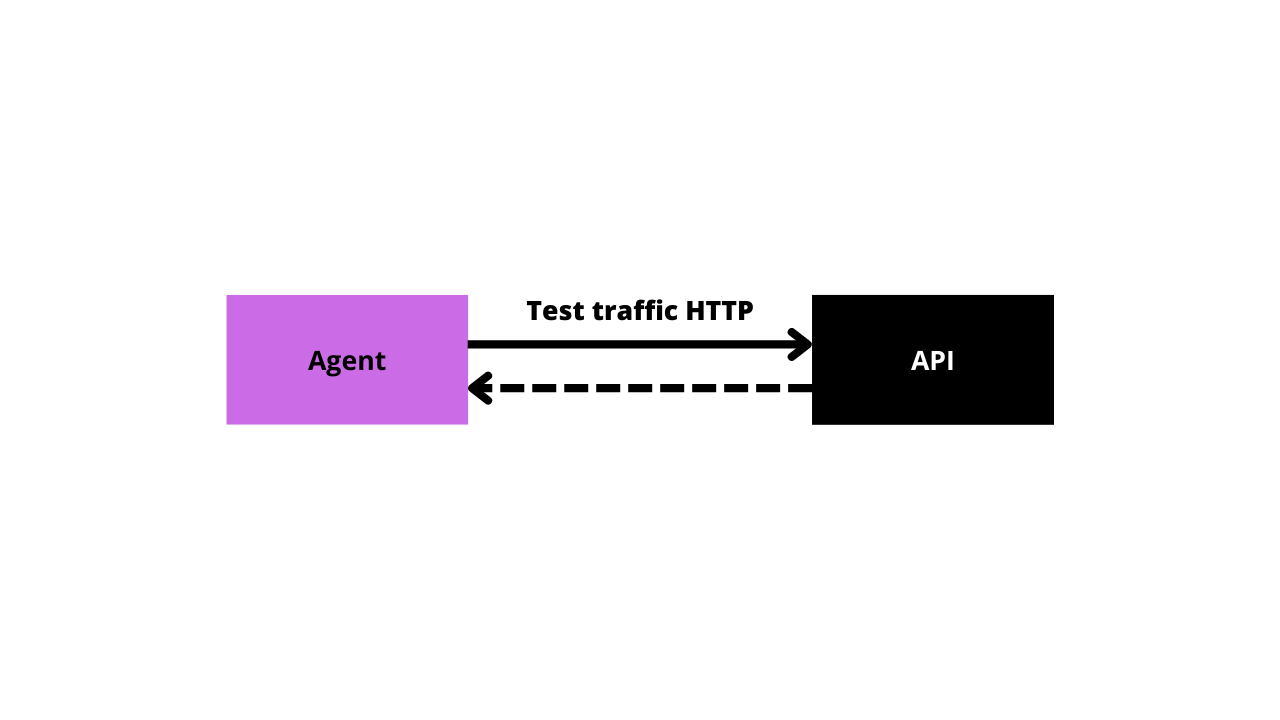
Black box API monitoring
This means API monitoring tools can only see as far as the API interface. While this can be very helpful as an automated alert system it will entirely miss some crucial dimensions of API health.
Let’s now take a look at the downsides of API monitoring tools to understand these limitations better.
API monitoring tools use synthetic data samples to test your API. This might be “lorem ipsum” data programmatically generated by a test data library, for example.
This data will not be as varied and multi-dimensional as real customer data, and therefore may not be able to surface the same kind of bugs.
It’s not just the data that is synthetic, but also the sequence and timing of API calls.
The danger of synthetic data is that it gives a false sense of confidence in your API robustness when in reality it only represents a narrow band of what a real customer may throw at your API.
Since API monitoring tools take measurement from outside of your API, they can only collect responses of your API and externally measurable metadata like timing.
This means that the internal state of the system is completely invisible and so important debugging information will not be present.
With only an outside view of the system, engineers will have to guess about what has caused a bug which can greatly slow down root cause analysis.
API observability is a type of API monitoring designed to provide a far wider scope of insight into your API health than what traditional API monitoring tools provide.
The key insights of API observability can be summed up as:
So instead of the “black box” approach API observability tools employ a “white box” approach where the API is observed from within.
To achieve this, API observability tools are installed directly in your system allowing them to passively collect data system-wide.
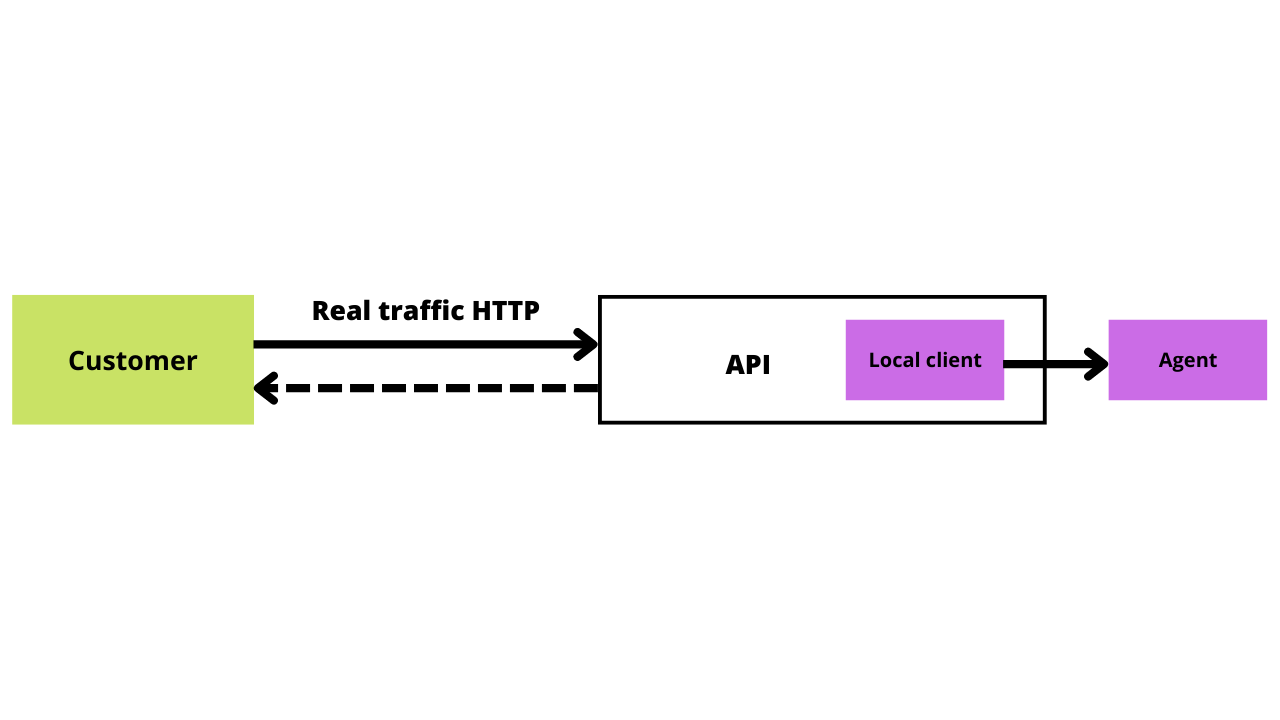
White box API monitoring
Let’s take a look at the advantages API observability offers.
Rather than synthetic data, API observability monitors real customer data by performing real-time traffic data collection and analysis on your API traffic.
This ensures your monitoring is aligned with what customers are experiencing and will therefore be more likely to identify the problems that will affect customers the most.
Unlike black box monitoring, you’ll be able to access data from the entire system when using API observability tools.
For example, a full-stack trace could be provided when an error occurs rather than just a snapshot of the API response.
This means your developers will be able to debug problems far quicker with API observability tools.
As mentioned, API observability tools are installed directly in your system allowing them to collect data from the API software and server.
Good API observability tools are unobtrusive and will passively report data that can be analyzed externally.
The three forms of data produced by API observability tools are:
Compare this dataset with what you get from black-box monitoring and you’ll see how much easier root cause analysis is when problems with your API inevitably arise.
We’ve considered how API observability overcomes the shortcomings of traditional API monitoring approaches. But the value of observability can go beyond just bug resolution.
Once you begin collecting observability data you now have a rich data set that can help you with anything from conversion optimization to product decisions.
Let’s take a closer look at some of the secondary uses of API observability data.
With API observability you’re able to see how your customers are actually using your APIs. For example, you may notice common errors are associated with a certain kind of mistake that may inform you of fields you should add or simply where to improve documentation.
Like all applications, APIs are vulnerable to misuse by bad actors. The rich data provided by API observability can be used to identify misuse patterns and enable engineers to proactively find vulnerabilities or business logic flaws before they are exploited.
API observability can be used for the marketing side of your business as well. You can use API observability data for analytics that can be combined with other customer data to answer product and business-related questions. For example:
To implement API observability, you’ll need to both record data (logs, metrics, and traces), and analyze this data.
If you’re thinking this will be a lot of work, you’ll want to check out Treblle.
Treblle is API observability software that can be installed with just a few lines of code. Not only that, but Treblle is unobtrusive in its logging of API traffic and system data.
Treblle can be plugged in to most systems from Laravel, .NET, to Node.js and more. Here’s an example of how the Treblle Node package can be added to an Express.js project.
const express = require("express");
const { useTreblle } = require("treblle");

const app = express();
app.use(express.json());

useTreblle(app, {
	apiKey: "_YOUR_API_KEY_",
	projectId: "_YOUR_PROJECT_ID_"
});
One concern that many organizations have is with security. Treblle makes it trivial to mask values like passwords or other identifying data before they leave your server.
useTreblle(app, {
  apiKey: "_YOUR_API_KEY_",
  projectId: "_YOUR_PROJECT_ID_",
  additionalFieldsToMask: ["secret", "private", "user_ssn"]
});
Once you’ve installed Treblle and pushed it to production, Treblle will start logging your API activity. You can then easily check your API health in the neat dashboard that Treblle offers to help you make sense of the data and avoid getting overwhelmed.
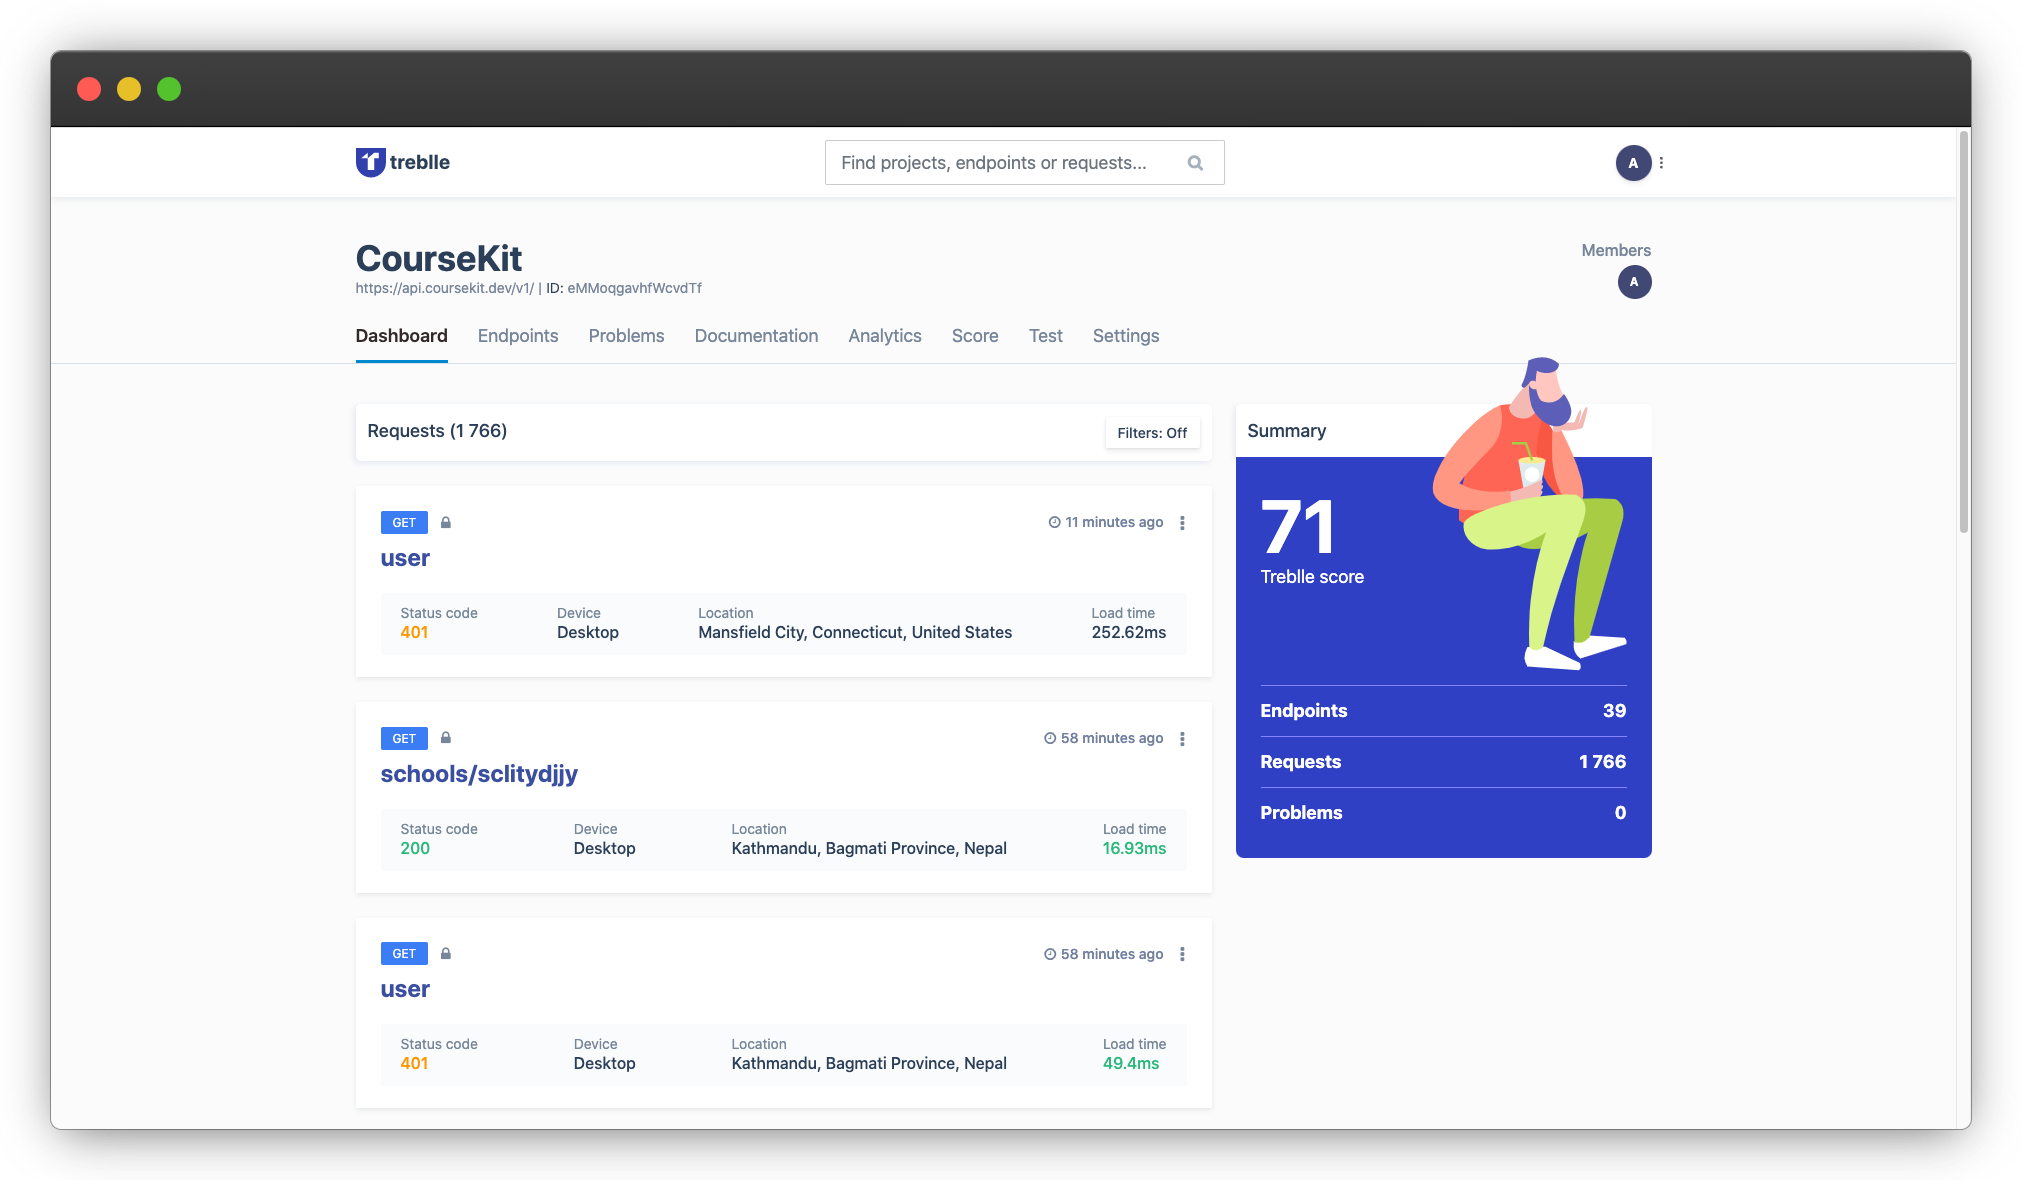
Treblle dashboard
In addition to API observation, Treblle offers your organization a variety of other useful features including:
And more. Treblle is free for up 30,000 requests and can be installed in minutes, so give it a try!
API monitoring tools provide a useful alert system that can tell your team when your API has a problem.
They can miss more subtle bugs, however, due to their reliance on synthetic data, and usually can’t provide much detail on why your API is failing, leaving it up to engineers to guess.
The goal of API observability is to learn what’s happening from within your API so that root cause analysis can be performed quickly allowing your team to resolve problems faster and keep customers happy.
API observability also offers other advantages to organizations including user experience and usage insights.
If you’re aiming to scale your API products it’s essential to consider API observability. Check out Treblle to get started.
All Systems Operational
Gartner: Magic Quadrant, 2025
Gartner AI API Strategy, 2025
Everest Group: Enterprise App Integration Platforms, 2026